When I first tried to answer "what did my agents actually do today?", the honest answer was: several different logs, three dashboards, and a spreadsheet nobody trusted. The tools existed. The problem was that nobody had explained how they were supposed to fit together, which piece owned which question, and where the system quietly lied.
This article is the explanation I wish I had read first. It walks the whole stack in order — from raw signals leaving an agent, through the collector, into storage, and out onto a dashboard — says what each piece is actually for, follows one real request end to end, and names the failure modes that only showed up once the system was live. Everything below is grounded in the rig that produces the numbers on this site: one bounded Prometheus/Grafana/OpenTelemetry snapshot, queried directly on 30 August 2026, with component roles cross-checked against the current rig documentation rather than inherited from earlier articles.
Why you should care, even if you run nothing
If you use AI tools at work, someone — you, a vendor, or an engineer down the hall — is making decisions about cost, speed, and reliability with almost no evidence. The telemetry stack is what turns "it feels slow and expensive" into a number you can argue with. Four practical questions depend on it:
- Cost control. Which provider, model, and session burned the tokens, and was the work worth it? Without per-request traces the answer is a guess; with them it is a bill you can audit line by line.
- Latency and reliability. Which provider is slow today, how often do calls fail, and does the retry policy hide the failure or report it?
- Provider and model selection. The same prompt can cost ten times more on one model than another, and the difference is only visible once the usage is counted per call rather than per month.
- Agency governance and client proof. When a client asks "what did this campaign actually cost us in AI time?", the honest answer comes from the same discipline that governs marketing measurement: named sources, reconciled totals, and gaps that stay visible instead of quietly becoming zero.
The same discipline applies to martech data quality and to client work generally. If the numbers cannot be traced back to a raw record, they are marketing, not measurement.
The pieces, in plain English
Agents and apps emit signals. Every coding agent, chat app, or scripted workflow produces events: a request went out, tokens were spent, a tool was called, something failed. In this rig that means Codex (the primary operator and delegator), Claude Code (review and web-facing tasks), Hermes (the work surface) and OMP (fast local execution), plus OpenClaw for broader personal automation. Each has a slightly different personality, but they share one property: alone, their output is noise.
Local gateways are the single door. Provider traffic goes through a local gateway (CLIProxyAPI in the current setup, with OpenRouter as the explicit fallback path) rather than straight to each vendor. One door means one place to count what entered, which provider answered, and what it cost. It also means the provider attribution problem is a routing problem with a paper trail, not archaeology across five dashboards.
The OpenTelemetry Collector is the traffic controller. Instrumented telemetry — the OTLP signals from agents and apps — flows through the Collector rather than straight to storage; raw session files remain a separate, direct-write path outside it. The collector receives signals in a standard format, batches them, retries on failure, and routes each type where it belongs. The choice that matters here is not "OpenTelemetry" as a brand; it is the decision to have one pipe. When a new agent appears, it plugs into the pipe; when a store is replaced, only the routing changes.
Prometheus stores metrics. Metrics are counters and gauges: tokens per hour, requests per provider, cost per day, active workers. They are cheap to store, fast to query, and perfect for "how much, how often" questions. On this rig the coding-agent exporter lands its per-session, per-model, per-provider counters here — the source behind the public token page. Deduplication happens before publication: the exporter and query pipeline resolve provider and session duplicates so the same request counted through two paths does not inflate the total; Prometheus then stores and exposes the resulting labelled series. The live snapshot behind this article held roughly 1,150 distinct session IDs and a retained lifetime total of about 11.6 billion tokens across all providers, queried directly from Prometheus on 30 August 2026.
Langfuse stores traces. A trace is one complete story: a single request, which model answered, how many tokens, what it cost, how long it took. Langfuse runs on ClickHouse, a columnar database built for exactly this kind of analytical querying. This is where cost-per-task answers come from, and where the difference between "the model was slow" and "my orchestration made three extra calls" becomes visible.
Session stores are the raw truth. The original JSONL and SQLite files that agents write never get deleted or summarised before they are read. Codex sessions live as per-session JSONL rollouts; OpenCode and OMP have their own stores; a cross-provider index lets a question like "which session was that?" be answered without grepping everything. When two dashboards disagree, these files settle the argument. They are also the reason an honest stack can say "I do not know" — because the raw record exists to prove the gap.
Grafana is the room where it becomes visible. Metrics from Prometheus and aggregates from Langfuse land as panels on dashboards. There are deliberately two views: a public, privacy-safe summary (totals, provider splits, no session content) and a private, full-detail room. The split is not cosmetic; it is the trust boundary that lets the numbers be public without exposing what was actually said inside a session.
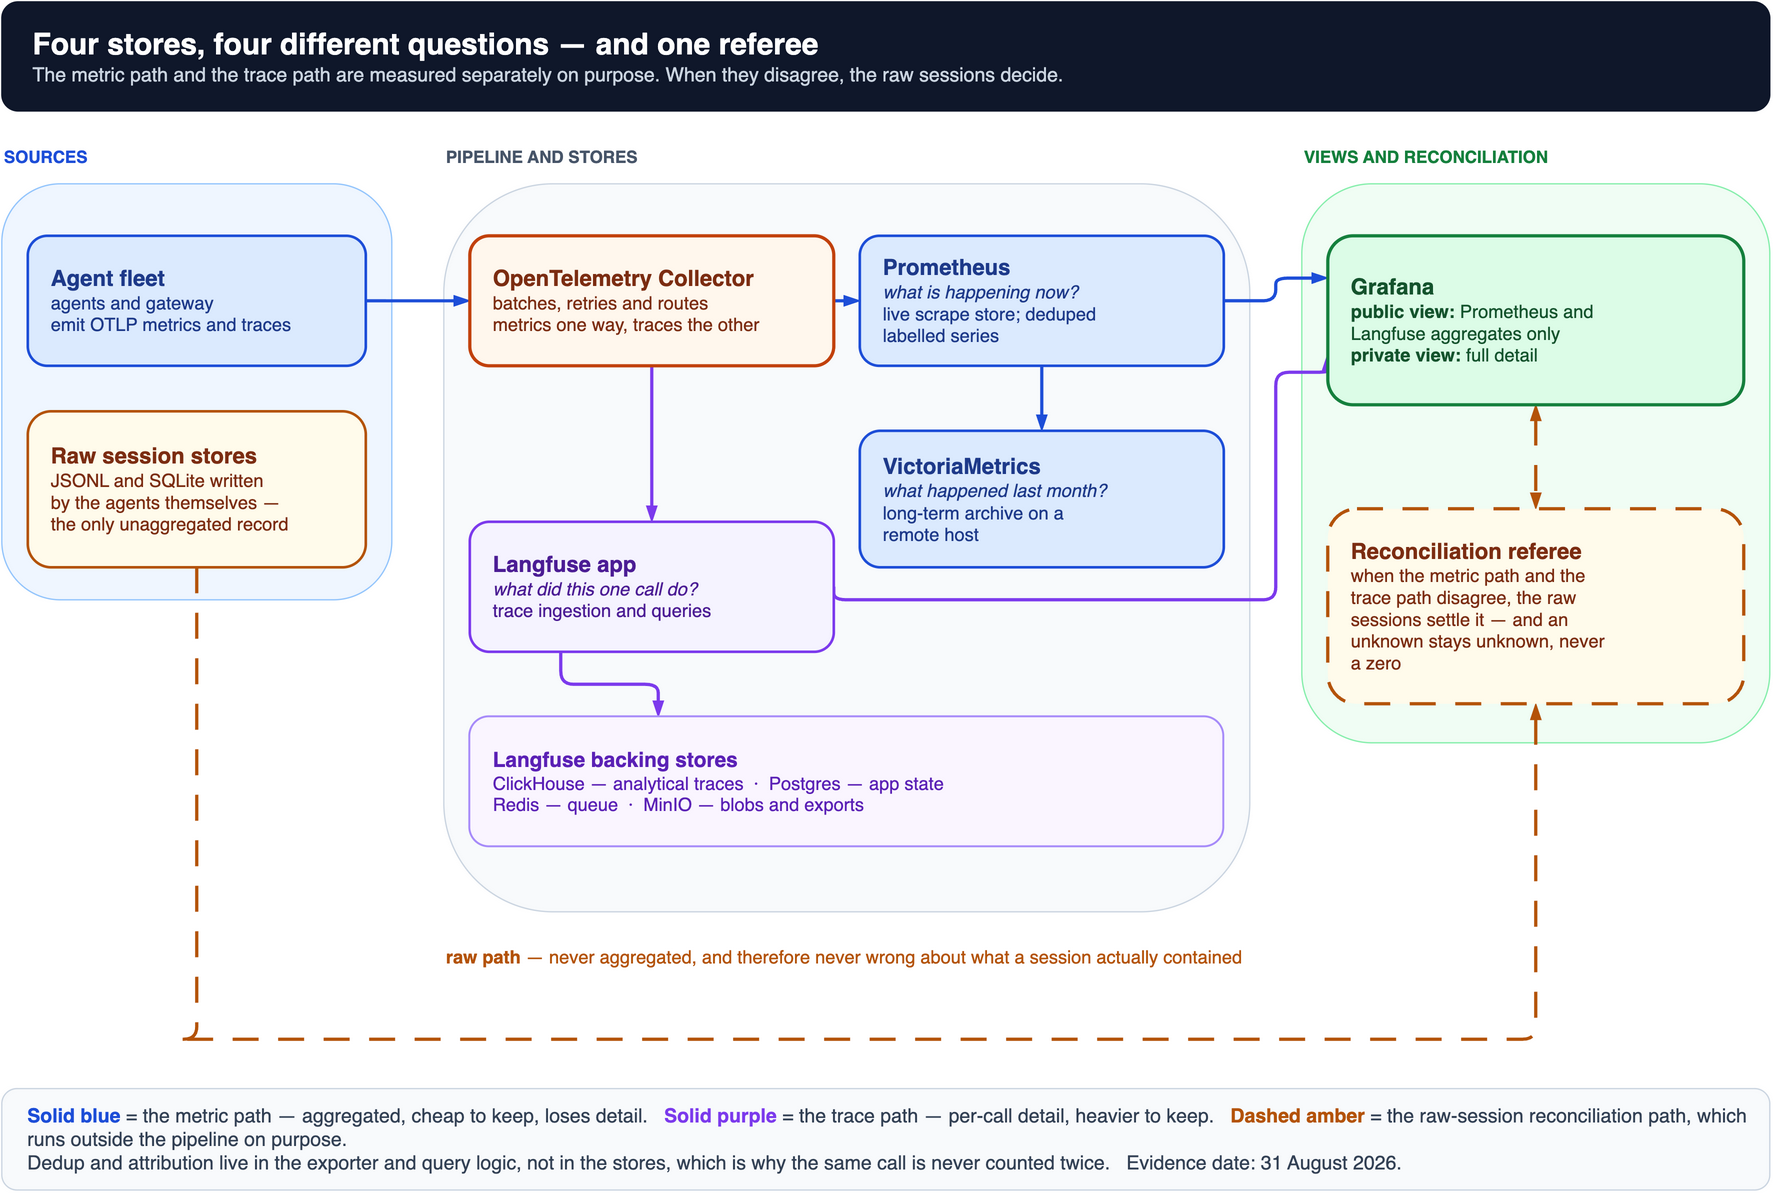
Four bands, one path: signals leave the agents, the collector routes everything, each store owns one job, and Grafana is where the result becomes visible. Download the native draw.io source.
The supporting cast, and what each is actually for
Postgres holds application state: who is allowed into which dashboard, what the ops board records, and the Langfuse metadata that is not analytical. It is not the measurement store; it is the system of record for the things the system itself needs to remember.
Redis queues work so a slow consumer does not block a fast producer. In the Langfuse stack it sits between ingestion and processing; in the wider rig it does the same job for background jobs that must survive a slow moment without losing one.
MinIO is S3-compatible blob storage, keeping exports and attachments on the machine instead of on someone else's invoice. It is storage for things, not for questions — you do not query it, you fetch from it.
VictoriaMetrics is the long-term archive. Prometheus is the live scrape store: what is happening right now, kept for weeks. VictoriaMetrics is the Prometheus-compatible archive that keeps private metrics for months without Prometheus's retention pain. The division of labour is simple — Prometheus answers "what is happening", VictoriaMetrics answers "what happened". In the current topology the archive runs alongside Coolify on the remote host, while the live scrape path stays local.
JSONL and SQLite session stores are what the agents themselves write. Unglamorous, append-mostly, and the only source that never gets rounded or summarised. The cross-provider session index exists so that "which session was that?" is a lookup rather than an afternoon.
Where one request's telemetry actually travels
Follow one real turn through the stack:
- The agent sends the request. A turn starts inside Codex, Hermes, or OMP. The request goes to a provider through the local gateway. Nothing has been measured yet beyond the agent's own knowledge that it is about to pay for something.
- The provider answers, and usage arrives with the response. Token counts, latency, and cost-per-call come back on the same response. The gateway has already recorded which door the request used, so attribution is a lookup, not a guess.
- The collector receives the event. The agent-side instrumentation sends usage, spans, and logs as OTLP to the OpenTelemetry Collector. It batches, retries, and fans the event out along three separate paths.
- The metric path. Prometheus counters increment: one more request for this model, so many input and output tokens for this session, one more tool call. This is the path the public token page reads. It is cheap, fast, and deliberately lossy — it knows how much, not what.
- The trace path. The same event lands in Langfuse as a trace with the full per-request story: model, tokens, cost, latency, which tools were involved. This is the path that answers "why did this one task cost what it cost".
- The raw-session path. Independently, the agent has been appending its own record to its session file. This path is not mediated by the collector at all. It is the ground truth: if the metric path dropped an event or the trace path lost a span, the raw file still knows what happened.
- Reconciliation. The three paths meet in two places. In Grafana, a disagreement between a metric total and a trace total is a query you can run, not a feeling. And when the dashboards disagree with each other, the raw session store is the referee: you open the file, read what actually happened, and fix the pipeline rather than the story.
This sequence is why the stack is trustworthy. Any single path can lie — a dropped event, a mislabelled provider, a counter that was read before the retry landed. The design assumes that and buys safety through redundancy: three independent records of the same request, plus a rule for which one wins when they disagree.
When the stack quietly lies
Running this stack produced a specific list of ways it can mislead, each one learned by being caught out at least once.
Cumulative counters look like per-task totals. Providers expose lifetime counters that only make sense once you subtract the previous value. Reading them as "this task cost X" inflates every number until the subtraction rule is written down and enforced. The fix is boring and non-negotiable: the pipeline, not the reader, owns the subtraction.
Unknown renders as zero unless you stop it. A missing metric, a provider that does not report usage, a session that never produced a trace — each of these can quietly appear as a zero on a dashboard, which looks like "free" rather than "unknown". The current pipeline carries an explicit provider_value_known flag per provider so the honest state — unknown — stays visible instead of collapsing into a confident zero.
Duplicate sessions and providers inflate totals. The same session can arrive through two paths, and the same provider can be known by two names. Without dedup rules, the total grows without any new work happening. The pipeline deduplicates by provider and session before anything is published.
Retention gaps are silent. Prometheus keeps weeks, not forever. If nobody exports the history, a question about last quarter becomes unanswerable, and the honest answer is "the record no longer exists", not "it was zero". This is the entire reason VictoriaMetrics exists in the stack.
Missing traces leave half a story. A metric says how much; a trace says why. When the trace path drops, the bill still arrives with no explanation attached. Treating a trace gap as a first-class failure — rather than an inconvenience — is what keeps the system diagnosable.
Local versus production boundaries. A pipeline that works locally can disagree with production for mundane reasons: a different provider name, a trailing newline in an environment variable, a different time window. The lesson from this site's own reporting stack applies directly: prove the production path, not just the local one.
Stores disagree with each other. Prometheus, Langfuse, and the raw sessions are three independent witnesses. When two of them disagree, the instinct is to average them. The correct move is to pick the referee — the raw session — measure the gap, and fix whichever pipeline dropped the event.
What this stack cannot prove
Honest limits, stated plainly:
- It measures work, not quality. Token counts and latency say nothing about whether the answer was good. A cheap, fast, wrong answer still looks efficient here.
- Cost is external. The stack measures tokens exactly, but prices are applied from published rates outside the pipeline. When a rate changes or a provider does not publish one, cost is labelled unknown rather than estimated.
- It cannot prove a negative. "No failures today" only means no failures were recorded. Absence of a trace is not evidence the work did not happen — it is a pipeline question, and only the raw session can settle it.
- It is single-rig evidence. Everything here is measured on one operator's machine and one remote host. It says nothing about your workload until you reproduce the same discipline on your own.
- Correlation is not causation. A model that appears cheaper may simply have been used on easier tasks. Attribution requires the routing decision to be recorded alongside the usage, not inferred afterwards.
Field notes that fed this article
This is the canonical description. Two earlier articles cover pieces of the journey and remain useful as field notes: One door for every token covers the routing gateway and cost feed, and why I made my agent token usage public covers the public summary pipeline. Where they describe older paths, this article is the current truth. How I built one control room for six AI agents and how I made Codex subagents measurable describe the multi-agent surface the telemetry sits underneath; the stack itself has not changed shape since those were written, only the attribution and dedup rules have matured.
A practical adoption path
If you are starting from nothing, resist the urge to install everything at once. Each step is independently useful:
- Start with raw sessions only. Turn on whatever JSONL or SQLite logging your agent already supports. You can answer a surprising number of questions with
grepand patience. - Add one metric store. Prometheus with a small exporter is enough to see cost shape per day. You do not need Grafana yet to get value; a single query a week is already a discipline upgrade.
- Add the collector. Once more than one agent exists, OTLP through one collector is what stops the pipeline from becoming spaghetti. This is the step people skip and regret.
- Add traces for the expensive path. Langfuse (or any trace store) earns its keep the moment you need to explain one expensive request, not all of them.
- Add long-term storage when retention starts hurting. VictoriaMetrics or an equivalent only becomes necessary when a question about last month matters. It usually does, eventually.
- Add dashboards and a public view last. Visibility is the reward, not the starting point, and the public/private split is a decision to make deliberately, not by accident.
A beginner can stop after step 2 and already be ahead of most teams. A team should not skip step 3.
Where to go next
The measurement discipline in this article is the same one that governs the marketing data work elsewhere on this site — the tools differ, the reconciliation logic does not. Start with:
- Agent Ops for people who don't run infrastructure — what happens when the dashboards raise an alarm
- Your Mac as an AI operations centre — the machine this stack runs on
- Why agent systems become slow, expensive and fragile — what the telemetry revealed about cost
- Proof, not prompts — the delivery standard that turns these numbers into evidence a client can check