Canonical update (2026-08-29): This article is a field note in the multi-agent journey. The consolidated through-line is The multi-agent journey.
How we got here
When I first started running AI coding agents on real work, I did what a lot of people do: I added structure. A lot of it.
Codex was my main agent, so I gave it a task tracker called Beads that gave every piece of work a durable ID and status. On top of that I ran BVR, a verification pass that reviewed each task before I trusted it. Before any substantial work started, a preflight script checked that a worker had been reserved. The worker itself lived in NTM, a session manager that kept OpenCode agents running in deterministic, sandboxed panes. And whenever a task got labelled high-risk, a fixed gate promoted it to GPT-5.6 Sol, OpenAI's most capable model at the time, for review.
Each layer made sense on its own. Together, they meant a simple request climbed six hops — parent agent, task tracker, verification review, delegation preflight, worker reservation, and then, sometimes, a frontier-model review — before a single line of code moved.
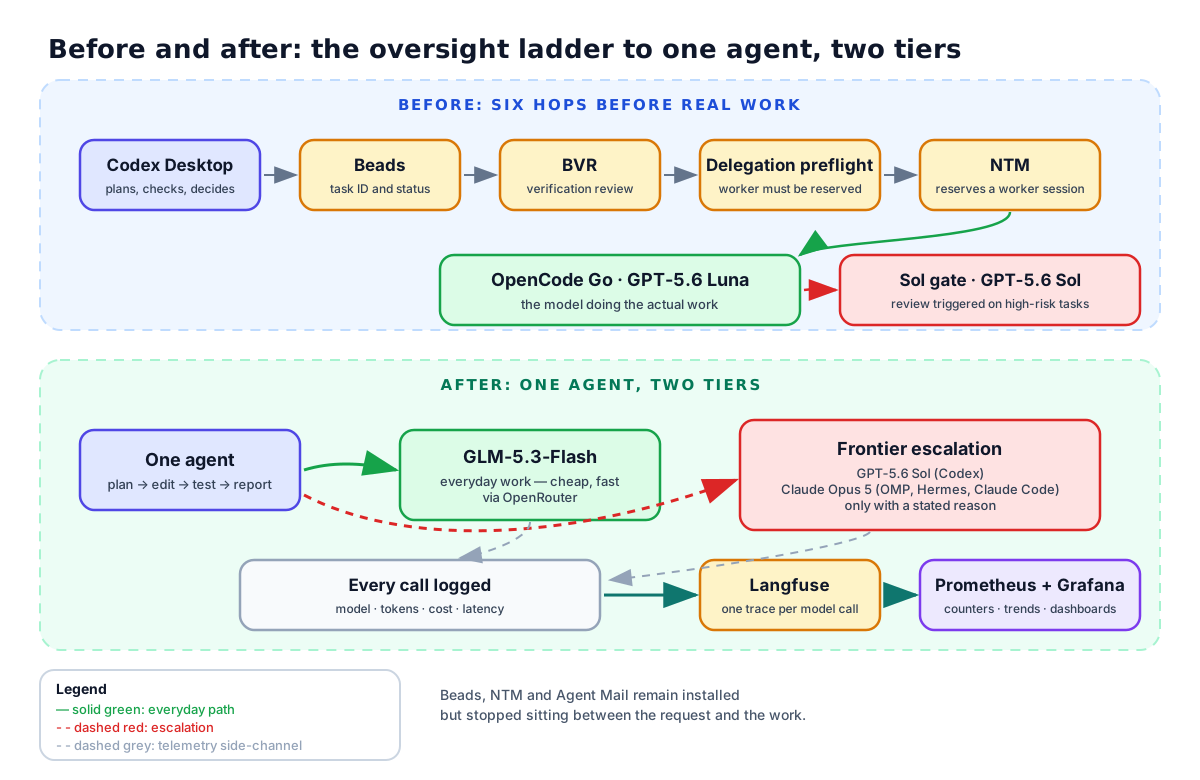
The old path and the new path side by side. Six hops before, one agent after. Download the editable draw.io source.
How we ended up here
The turning point wasn't a failure. It was a receipt.
Langfuse, which I run self-hosted, records a trace for every model call — which model handled it, how many tokens went in and out, what it cost, and how long it took. A small exporter pushes those counts into Prometheus, and Grafana turns them into charts I can actually read. None of this is exotic. It is a receipt book and a dashboard.
When I finally read the receipts instead of trusting the process, the story was uncomfortable. Most of the oversight machinery was catching errors that weren't happening. The frontier-model review gate fired far more often than the work justified. The cheap, fast model I was paying pennies for could have handled most of what the expensive path was being fed. And every hop added latency — not because the models were slow, but because the orchestration between them was.
What we're doing now
The new setup has one rule: one agent per task, and you have to say why before you escalate.
Every task is planned, edited, tested, and reported by a single agent in the same session. The everyday workhorse is GLM-5.3-Flash, a fast and cheap model from Zhipu routed through OpenRouter. Across all four of my coding tools — Codex, OMP, Hermes, and Claude Code — the same model handles the routine path, which keeps the cost predictable and the behavior consistent.
When something genuinely hard shows up, the task escalates once, and the escalation has to state a reason. For Codex that reason triggers GPT-5.6 Sol, because it matches Codex's native protocol best. For OMP, Hermes, and Claude Code, it triggers Claude Opus 5, which has the strongest tool-calling record through OpenRouter of the frontier models I tested. The point is not that these are the only good models. The point is that the choice is deliberate and the reason is recorded, so a frontier model can't fire just because a task was labelled scary.
Beads, NTM, and Agent Mail are still installed. They just stopped sitting between the request and the work. ToolHive still provides isolated MCP endpoints when a task needs browser or retrieval access, and Agent Mail still exists as an optional cross-tool bridge — none of it runs by default anymore.
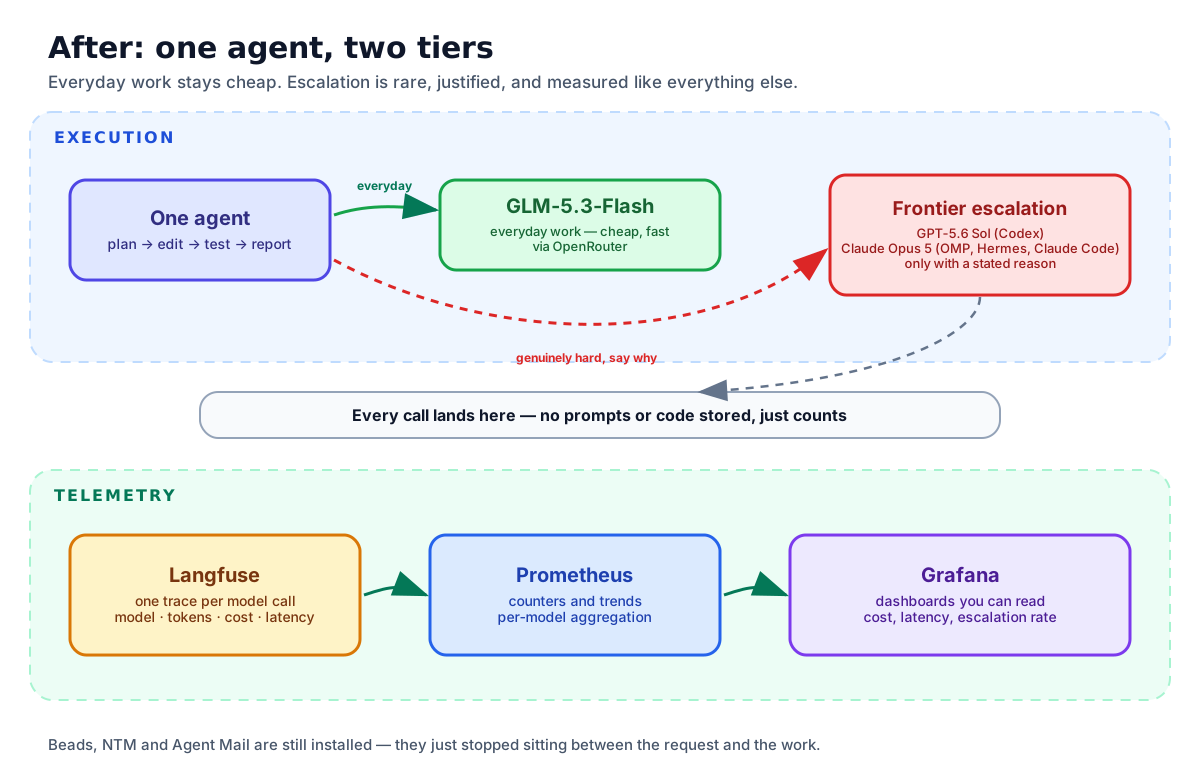
The new path. One agent, two tiers, and a telemetry side-channel that makes every call measurable. Download the editable Excalidraw source.
How telemetry makes it measurable
Before this change, "is this setup working?" was a feeling. Now it's a number I can query.
Every model call, regardless of which tool made it, lands in Langfuse as a trace. That trace carries the resolved model name — not the alias, the actual model that answered — plus token counts, cost, latency, and whether it was part of a retry. The OpenRouter exporter in my Grafana stack aggregates those traces into per-model counters, so I can see at a glance how much work GLM-5.3-Flash did this week versus Claude Opus 5, and what each cost.
This matters for the escalation rule specifically. Without telemetry, an escalation is a judgment call and you never find out if it was right. With telemetry, I can look at the specific trace where Claude Opus 5 was invoked and ask: did a stronger model actually produce a better answer here, or did I just pay more for the same output? That question is answerable now, and the answer shapes when I escalate next.
What the data actually shows
I ran the same small canary through both tiers to see the difference in practice.
The routine canary — add a function, run the test — went through GLM-5.3-Flash in about two and a half minutes of agent time, roughly 50k tokens of session traffic, and cost pennies. It edited the file, ran the test, and reported pass. No escalation was needed and none was triggered.
The escalation canary — a deliberately architectural question about whether that same tiny program should be restructured — went to Claude Opus 5. It cost more and took about a minute. What it produced was the interesting part: it correctly declined to restructure a two-function file, and instead flagged the real risk, which was that the add function silently concatenates strings and lists because it defers to Python's + operator. That is a materially sharper judgment than a routine implementation pass would give, and it is exactly the kind of call worth paying for.
| Canary | Model | Latency | Tokens | What it proved |
|---|---|---|---|---|
| Routine edit and test | GLM-5.3-Flash | ~2m 29s | ~50k | Ordinary work needs no frontier model |
| Architecture judgment call | Claude Opus 5 | ~56s | small | Escalation earns its cost when justified |
| Multi-file direct edit | GLM-5.3-Flash | ~1m 47s | small | Multiple files alone never triggers delegation |
| Native subagent delegation | parent + 1 child | ~6 min incl. spawn | minimal | Delegation path still works, still capped at one |
Same repo, same task shape, two tiers. The cheap model handles the routine path; the expensive model is reserved for judgment calls that need it.
Across the whole migration window, GLM-5.3-Flash accumulated roughly $1.96 in cumulative cost while doing the bulk of the routine work, versus about $2.50 for Claude Opus 5 over a comparable period doing far fewer, far more targeted calls. Those are cumulative counters from the Grafana dashboard, not per-task bills, so treat them as a shape rather than an invoice. The shape is what matters: the cheap tier does the volume, the expensive tier does the judgment, and the telemetry makes both visible.
What I'm watching next
Two things keep me honest here.
First, Claude Code's Claude Opus 5 route goes through OpenRouter's Anthropic-compatible surface rather than Anthropic natively. The canary passed, but I haven't yet run a long agentic session through it, and tool-schema edge cases are exactly where compatibility layers tend to show their age. I'm watching that before I trust it with anything substantial.
Second, the dashboards I used for this article are ones I've queried directly but haven't walked visually in a browser. The numbers are right; the presentation of the numbers is still something I want to eyeball before I call the observability story finished.
The bigger bet — one agent, escalate only with a stated reason, measure everything — feels like the right resting point. It isn't minimal for its own sake. It's minimal because every extra layer I removed turned out to be a layer the data never asked for.