Canonical update (2026-08-29): This article is a field note. The canonical description of the full telemetry stack now lives in The agent telemetry stack, explained from first principles.
The full path
Requests go out the door. Traces come back the same day.
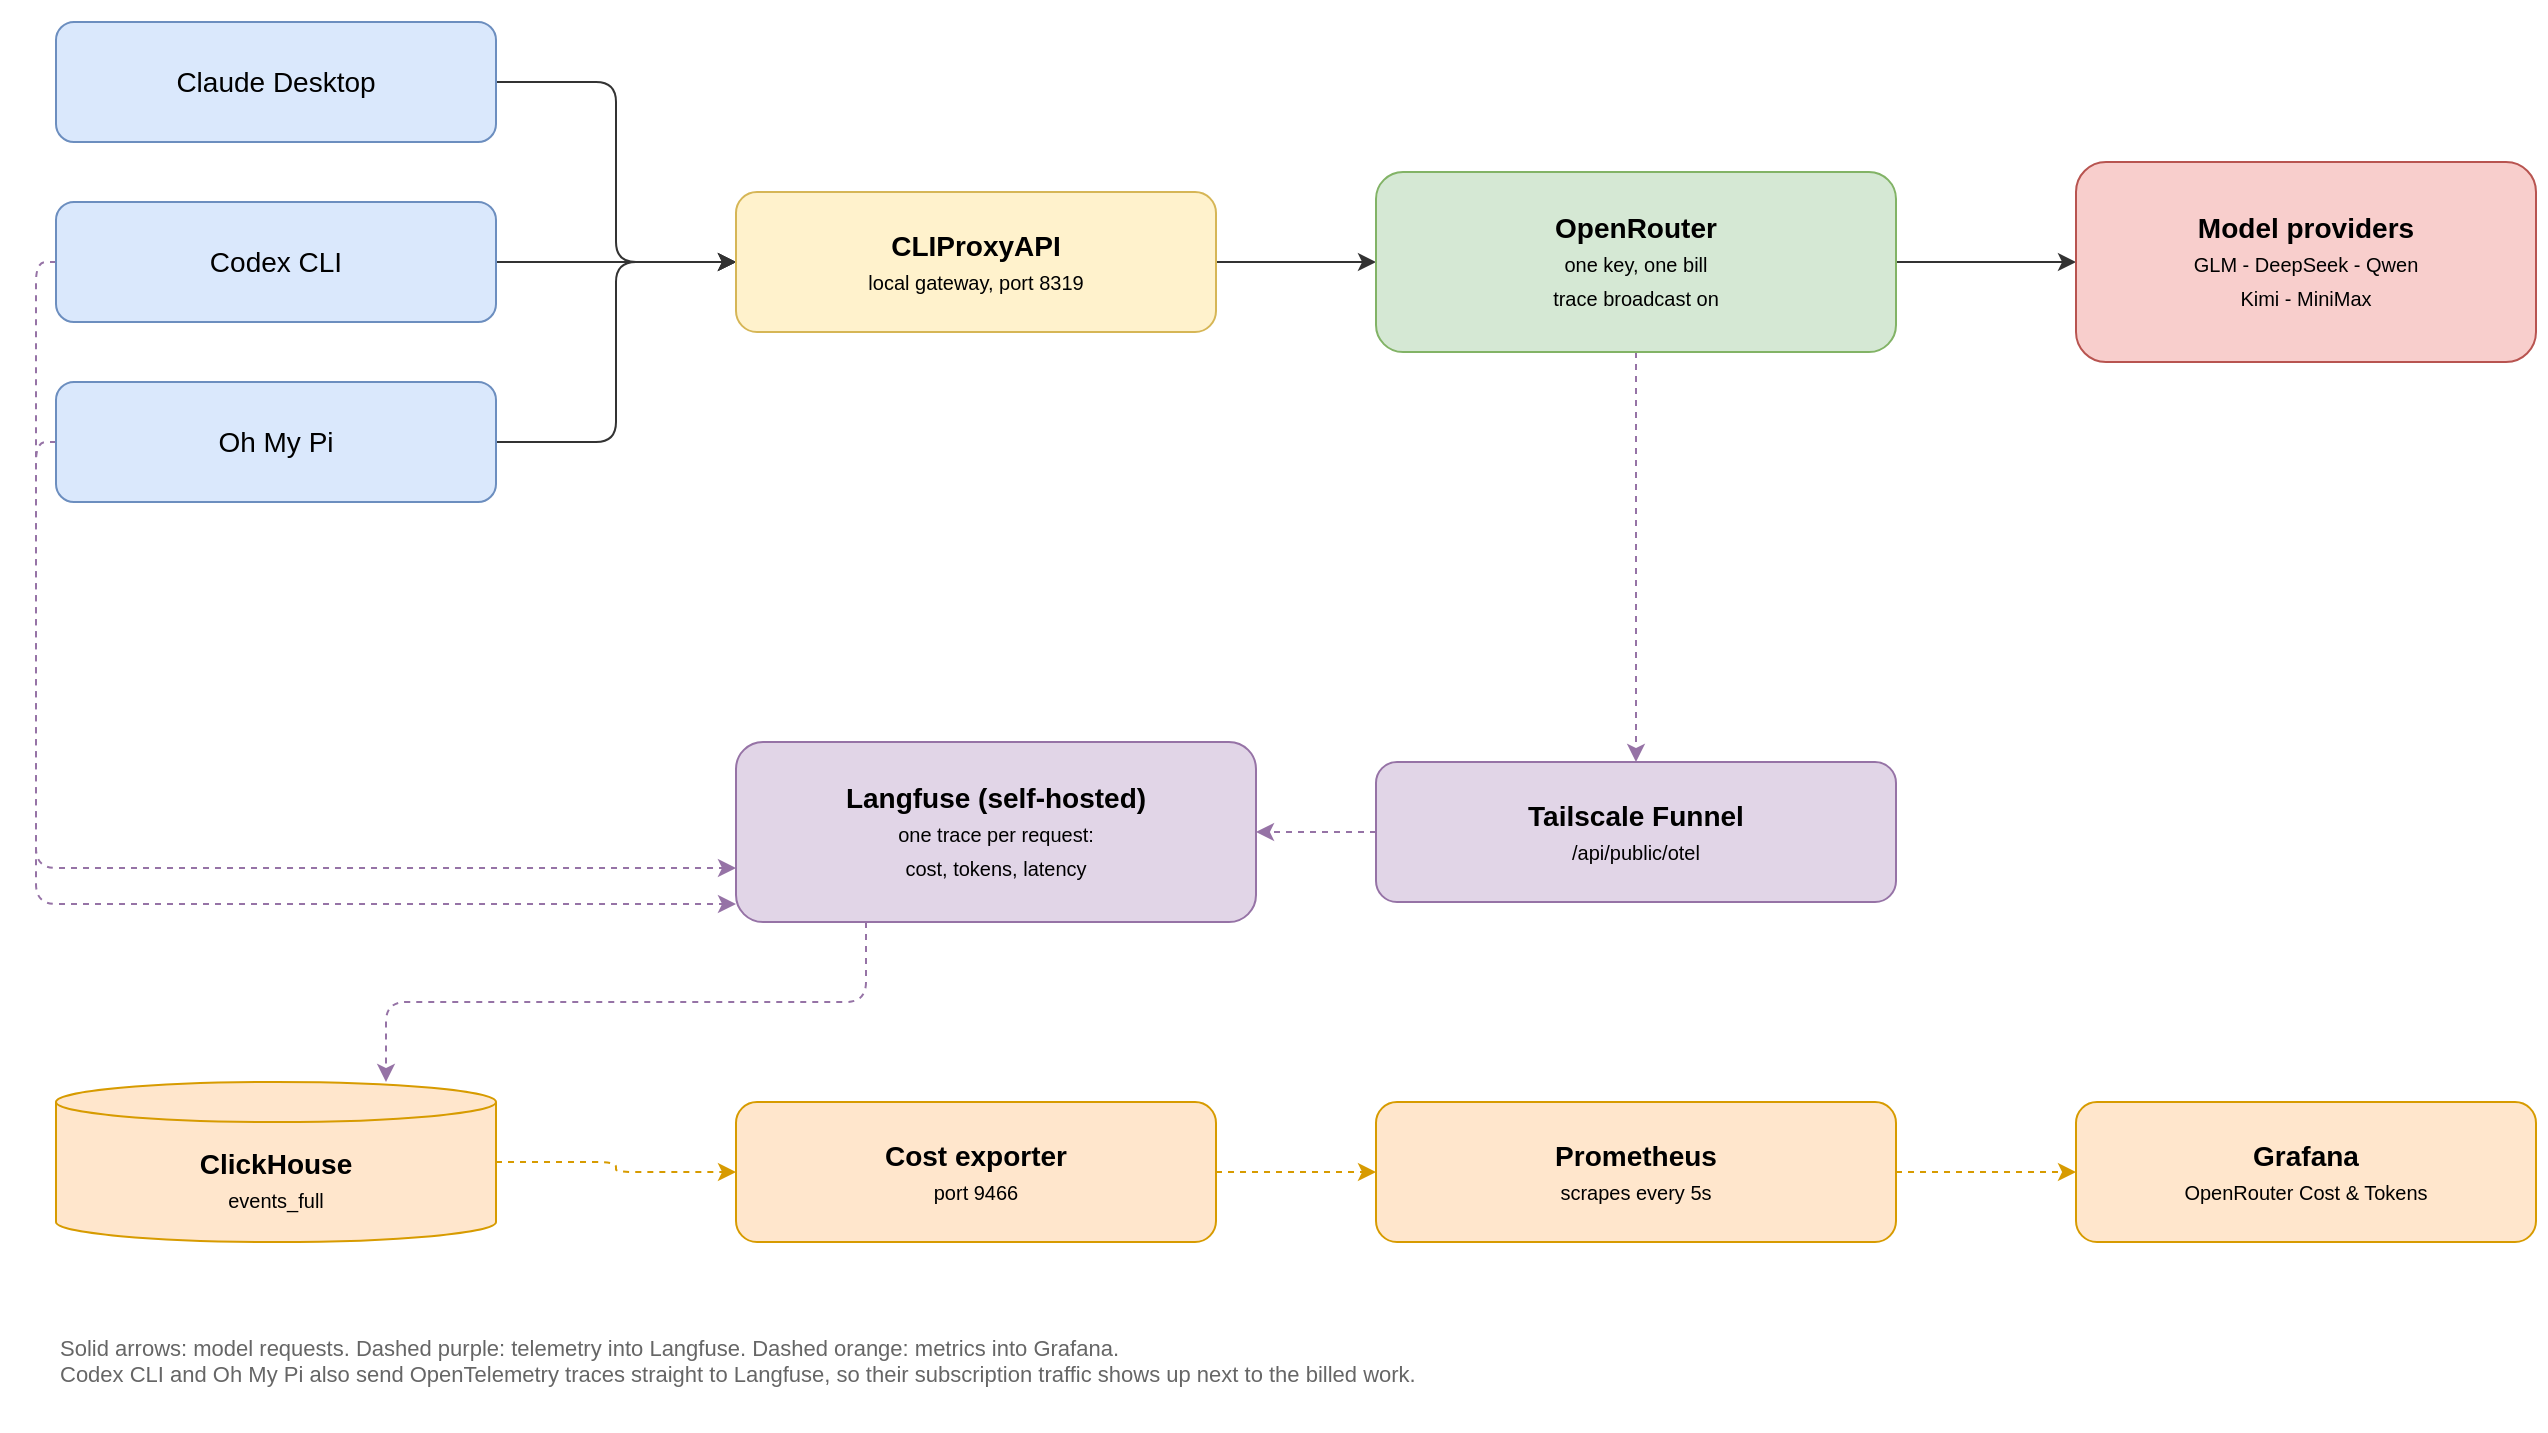
I use three different AI apps on my Mac: Claude Desktop, Codex CLI, and Oh My Pi. Each one had its own way of billing, its own logs, and its own idea of what a "usage report" looks like. When a bill surprised me, I could not answer a basic question: which app, which model, which task?
So I gave them one door.
Every app now talks to a small local gateway on port 8319. The gateway forwards to a single OpenRouter account. And OpenRouter does something useful for free: it writes a trace for every request, with the model, the token counts, the latency and the cost, and pushes that trace to wherever I point it.
The traces land in my own Langfuse. A tiny exporter reads the aggregates and feeds Prometheus. Grafana draws the bill.
What the door looks like
The gateway is CLIProxyAPI, running on localhost. It exposes a Claude-compatible API, so Claude Desktop connects to it like a normal Anthropic endpoint. Nothing in the app changes. No rebuild, no patched binary, no vendor login inside a proxy I don't control.
Claude Desktop ──┐
Codex CLI ───────┼──▶ CLIProxyAPI :8319 ──▶ OpenRouter ──▶ GLM / DeepSeek / Qwen / Kimi / MiniMax
Oh My Pi ────────┘
Behind OpenRouter I keep a small stable of models: GLM for the everyday workhorse traffic, DeepSeek for flash tasks, Qwen, Kimi and MiniMax for variety. One API key. One invoice. And, the part I care about most, one ledger of every call.
Traces without writing an instrumentation line
OpenRouter has a broadcast feature: give it an endpoint, and it sends an OpenTelemetry trace for every request it handles. No code changes in any app, because the tracing happens at the door, not inside the apps.
I point the broadcast at my self-hosted Langfuse through a Tailscale Funnel URL. Langfuse stores each trace in ClickHouse: model name, input tokens, output tokens, latency, and the cost OpenRouter charged, per request.
Two details that took some digging:
- The funnel strips the mount prefix, so the target URL has to include the full path (
/api/public/otel/...), not just the host. - Langfuse v4 stores everything in one ClickHouse table (
events_full). The oldertracesandobservationstables stay empty. If you query the old tables, you will wrongly conclude the pipeline is broken.
From traces to a dashboard
Langfuse answers "what happened in this request". I wanted the follow-up question answered continuously: what does my fleet spend per model, per hour, right now?
That is a 100-line Python exporter. It queries Langfuse's ClickHouse once per scrape and serves a handful of Prometheus metrics on port 9466:
openrouter_requests_total{model}        # every generation seen by Langfuse
openrouter_cost_usd_total{model}        # billed USD per model
openrouter_input_tokens_total{model}    # input tokens per model
openrouter_output_tokens_total{model}   # output tokens per model
openrouter_cost_usd_24h{model}          # rolling 24h spend gauge
openrouter_latency_p95_seconds_24h{model}
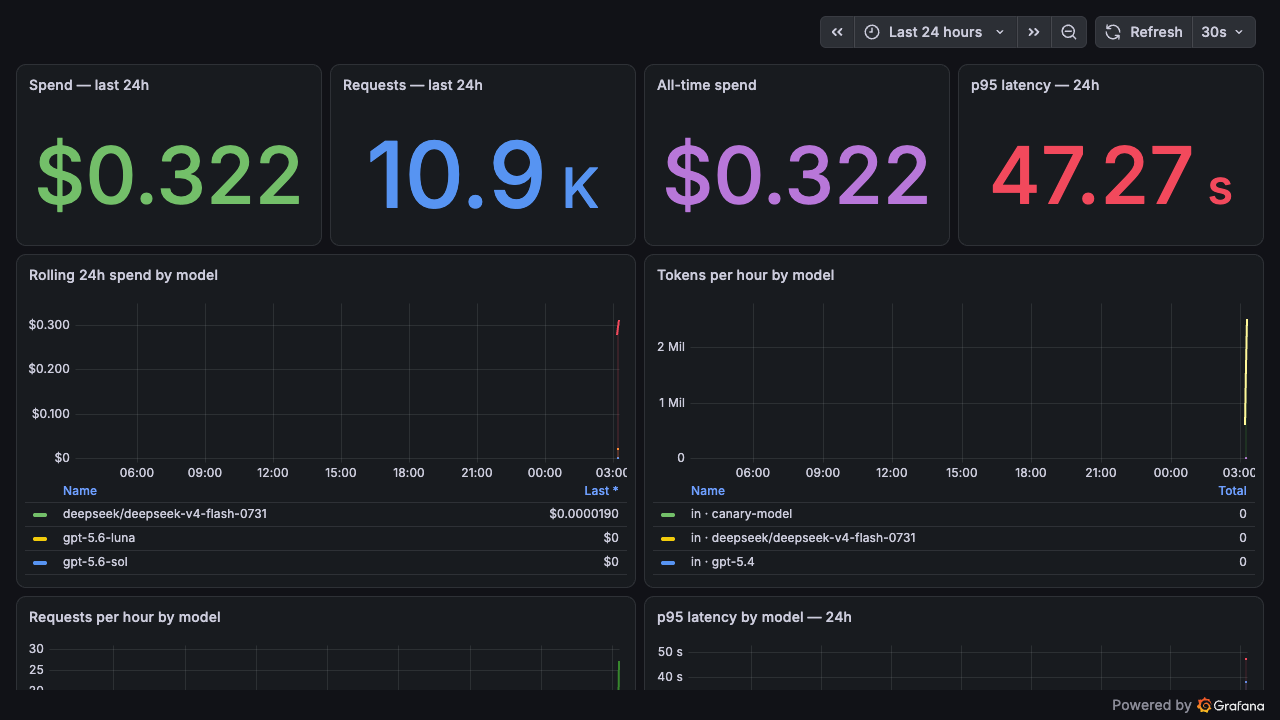
Prometheus scrapes it every 5 seconds, next to the existing coding-agent metrics. Grafana gets a dashboard called OpenRouter Cost & Tokens:
The first render
Spend, requests and latency on one screen
What the first numbers show
The window is short, but the shape is already clear.
Three things I learned from the data that I could not have told you last week:
- My agent traffic is many small calls, not few big ones. The average request is tiny; the volume is the bill. Cost per request matters less than requests per task.
- The cheap model is doing enormous reading. Nearly 13 million input tokens against 26 thousand output tokens. The value is in what it reads, not what it writes, which is exactly what I want from a workhorse.
- Latency and cost disagree. The cheapest model is also the slowest at p95. Whether that trade is worth it depends on the task, and now I can see the trade instead of guessing.
What it cannot see yet
Honest limits, because a dashboard that overclaims is worse than no dashboard:
- Codex CLI and Oh My Pi also send their own OpenTelemetry traces straight to Langfuse. Those calls run on an OpenAI subscription, so they show up with token counts and $0 cost. Request totals therefore count all models; the cost panels only move for billed work.
- The Mac sleeps. My laptop hosts the funnel, so a sleeping Mac misses any traces sent while it sleeps. The gap shows up as flat hours in the charts, not as wrong numbers.
- The dashboard is young. The spend-by-model panel gets useful once Prometheus has days of history, not minutes.
The parts, if you want them
- Gateway: CLIProxyAPI on localhost, one config file, apps point at
http://127.0.0.1:8319. - Traces: OpenRouter → Broadcast → Tailscale Funnel → self-hosted Langfuse (docker compose from Langfuse's repo).
- Metrics: a Python exporter querying ClickHouse's
events_fulland serving Prometheus text format. - Dashboard: Grafana with four stat panels and four time series, 30s refresh.
The exporter is deliberately boring: one SQL aggregate, one HTTP endpoint, no state. If Langfuse's schema changes, the fix is one query string. That is the right size for a component whose entire job is moving numbers from one honest store to another.
The door does not make the models smarter. It makes the bill legible, and it turns "I think the cheap model is slow" into a number I can act on.