Canonical update (2026-08-29): This article is a field note. The canonical telemetry description is The agent telemetry stack.
I had reached the point where my AI setup could do a lot, but I could not answer a basic question quickly: what is everything doing right now?
I had OpenClaw, Hermes, Codex, OMP, Claude Code and Droid/OpenCode activity spread across different stores and interfaces. Some ran on my MacBook. Others ran on a Hetzner server through Coolify. A green container did not prove that Telegram worked, and a token total did not tell me whether a cost was known or merely missing.
So I treated the agent setup as an operations problem, not a prompt-writing problem.
The role split is a default, not a cage
The first change was giving each agent a clear starting job:
- OpenClaw is personal by default. It handles personal email, calendar, Drive, web research and everyday requests.
- Hermes is work-focused by default. It handles engineering and work workflows.
- Codex and OMP are general-purpose agents and escalation routes. They take larger builds, difficult investigations and work that benefits from a stronger harness.
These are routing hints, not hard permission walls. I deliberately kept each agent broadly capable. The point is to reduce confusion about where a request should start, not to make an assistant refuse useful work because a label says “personal” or “work”.
The main hard boundary is ownership: only I should be able to instruct the private agents. Credentials stay in the macOS Keychain on the laptop, or in the protected environment of the server service that needs them.
System map
Roles guide the route; telemetry joins the result
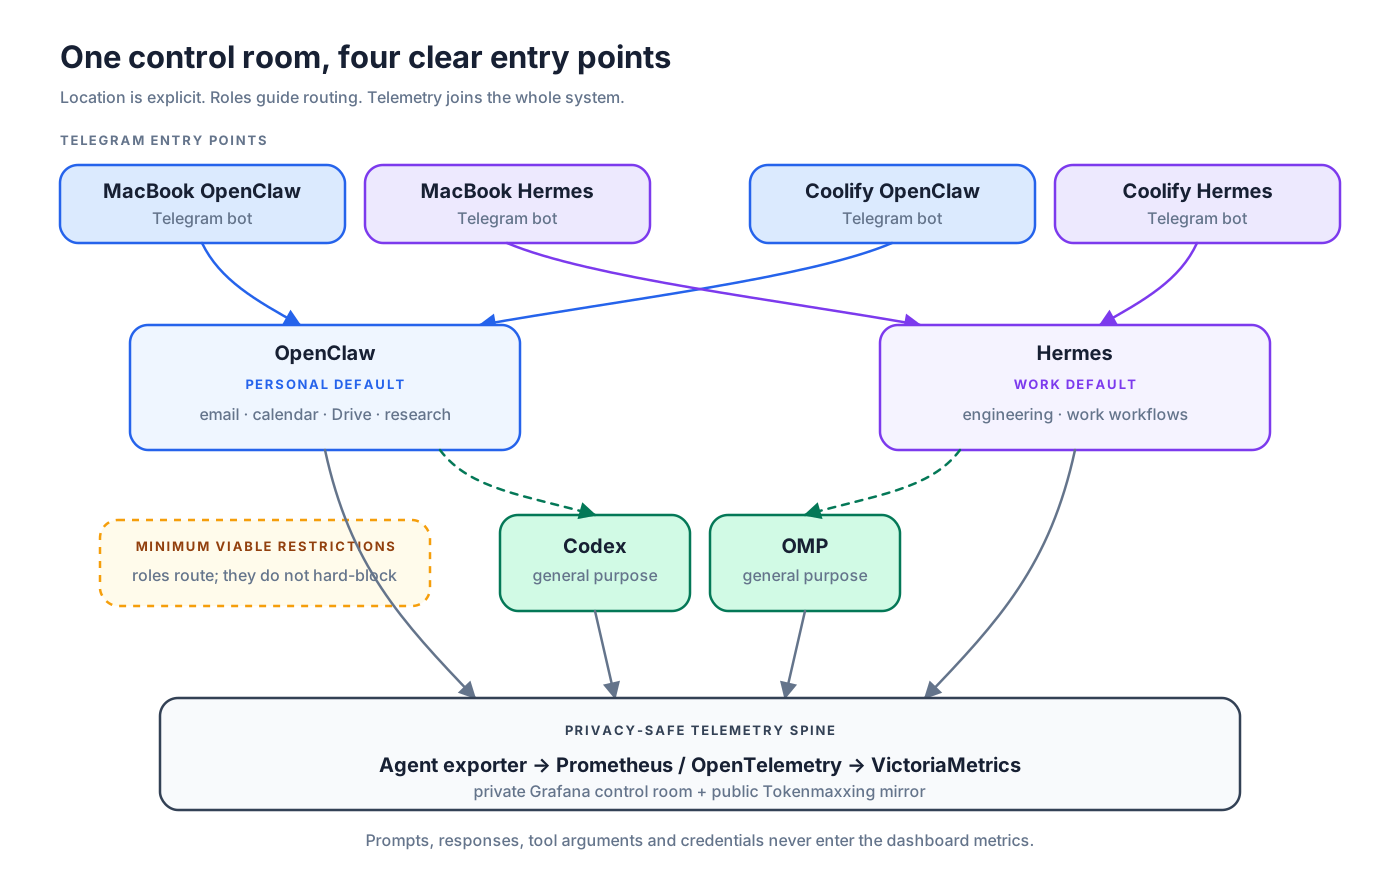
Four Telegram bots, with names that explain where they live
I run two OpenClaw/Hermes pairs, and mixing them up was an easy operational mistake. The cloud pair and the MacBook pair now have explicit display names:
- MacBook OpenClaw
- MacBook Hermes
- Coolify OpenClaw
- Coolify Hermes
All four passed the test that matters: a real Telegram message produced a real reply through the intended agent. That is more useful than proving that a bot token exists or a container is running.
The same rule applies elsewhere. Google Workspace access was tested by listing real Gmail labels, calendars and Drive results through the authenticated account. Software maintenance was split into a daily update check and a cautious weekly stable-update run with backups, health checks and rollback. Major macOS upgrades and surprise reboots are not part of that automation.
One small exporter instead of six incompatible stories
The agents do not record usage in the same way. Codex has one session format. OMP has another. Hermes keeps state in SQLite. OpenClaw and Claude Code expose different fields again. Some providers record cost directly; others do not.
The exporter normalises those sources into a small common model:
- agent
- session
- project
- model
- prompt and completion tokens
- measured or estimated cost source
- source availability and freshness
Duplicate cumulative records are reduced to one provider/session value before aggregation. Missing cost is labelled unknown, never silently converted to zero. Prompts, responses, tool arguments and credentials are not exported.
That distinction matters. A tidy dashboard can still be wrong if it adds the same cumulative session more than once or makes an unavailable price look free.
The five dashboards I actually need
I removed the old Grafana views and replaced them with five plain-English dashboards:
- System Overview — whether the tracked services, endpoints and harnesses are up.
- Usage and Cost — tokens and known spend by agent, model and project.
- Reliability — failed exports, stale collectors and unhealthy components.
- Work and Activity — filterable session-level usage without conversation content.
- Data Quality — unavailable sources, stale data and sessions whose cost is unknown.
The local Prometheus and OpenTelemetry stack remains the source. Prometheus writes a second copy to VictoriaMetrics on my Coolify server, where Grafana reads it. Both remote endpoints use HTTPS. Grafana requires a login, and the public metrics endpoint accepts authenticated writes but does not expose the query API.
I also migrated the existing local history rather than starting the remote charts from zero. The retained window covers 30 July onward and continues rolling for 90 days.
In the final browser proof, all 19 tracked components were up and the page loaded without console errors. The snapshot showed about 1,180 indexed sessions, roughly 545 million known tokens attached to sessions active in the previous 24 hours, and $9.33 in known spend. Those are point-in-time operational figures, not an invoice or a claim that every provider cost is captured.
The daily view is for decisions, not decoration
At 8:05 each morning, OpenClaw sends me a cross-agent overview in Telegram. It is a command job, so an empty reporting step does not need another model turn just to read the numbers.
The report answers four questions:
- Which agents were active?
- How many tokens can be measured?
- Which costs are known, estimated or unknown?
- Is any part of the system unhealthy or stale?
The pinned Codex Remote Control Tower uses the same idea for mobile work. A remote-compatible Codex thread can list and read local workers, pass on an instruction, wait for progress and summarise the result. Local OpenRouter workers may still be absent from the mobile sidebar, so this is mediated control rather than a claim that every local chat magically appears remotely.
The tower now reports each relevant thread separately: total and window tokens, measured cost status, context pressure, compactions, attempts, failures and a rotation recommendation. Token volume alone does not trigger a handoff. Rotation advice comes from context pressure and whether a long-running task has actually stalled.
What it costs
Grafana, Prometheus and VictoriaMetrics are open source. I did not add a paid observability service. The remote control room uses spare capacity and persistent storage on the Hetzner server I already run through Coolify, so the side effect is incremental CPU, memory, network traffic and disk use rather than a new SaaS bill.
Model use is different. The reporting command itself is deterministic, but agents still incur their normal subscription or provider usage when they do real work. Where a provider price is not measured, the system says “unknown”. That is less satisfying than a complete total, but more useful than a confident lie.
The practical lesson
The biggest improvement did not come from adding another agent. It came from making identity, evidence and failure states boring.
Every bot name says where it runs. Every role is a helpful default rather than an overzealous restriction. Every important integration is tested through the same path I use. Every dashboard explains what an empty value means. And every remote-control claim is limited to what the system can genuinely do.
That makes the agents feel less like six separate experiments and more like one system I can understand.