Ask someone why their agent system is slow and they will blame the model. The telemetry says otherwise. Across my own measured runs, most of the cost and latency accumulated around the model, not inside it: planning layers that re-read whole contexts, reviewers that re-read the work, pollers that woke models to confirm nothing had changed, and retries that quietly multiplied every hop. This article is the canonical description of those mechanisms, how to see them in your own traces, and what fixing them actually looked like.
It stands between two companion pieces. The agent telemetry stack explains the measurement machinery these findings depend on. The multi-agent journey tells the architectural story that follows from them. Neither article re-derives the mechanisms below, and this one does not re-derive their tool choices. Here it is the mechanisms, the evidence, and the trade-offs.
The four mechanisms
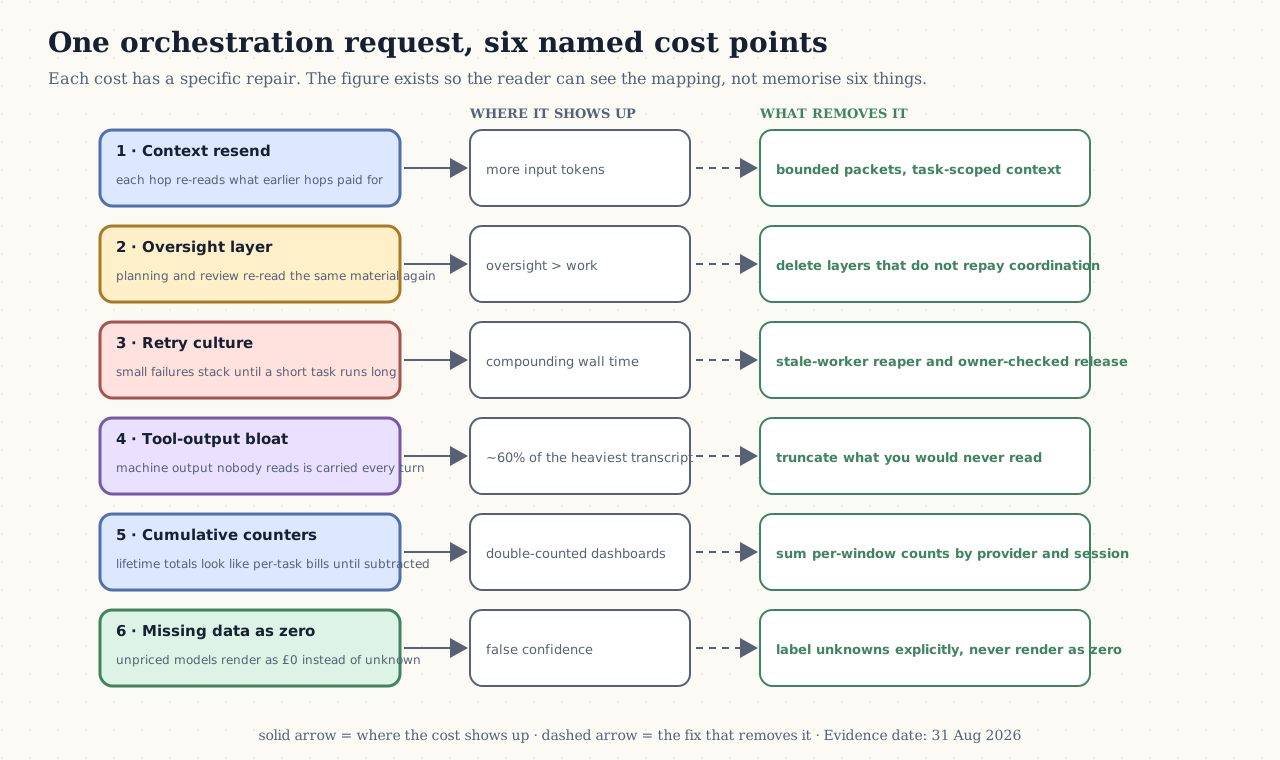
Context resends make every hop pay for every earlier hop. When a planner hands work to a worker, the worker receives its instructions again plus enough history to act. The reviewer reads the output plus the original context. Each hop re-bills tokens the previous hop already spent.
Oversight costs more than the work. Planning, review and polling are not free supervision — they are real spend, billed in the same tokens as the task itself. In the one-agent-two-models comparison, oversight across four orchestration layers exceeded the tokens the actual task used.
Failures are cumulative, not isolated. A single retry is cheap. A retry culture is not: inbox errors, browser reconnects, tool-output bloat and stale workers each add a little, until a two-minute task becomes a twenty-minute session.
Latency and cost diverge. A cancelled task still bills its tokens, and long tool calls block the inference loop. That is why "it took ages" and "it cost a lot" are different measurements, and why they need separate dashboards rather than a single blended number.
Symptoms first, mechanisms second
| What you notice | What is usually behind it | Which mechanism |
|---|---|---|
| "It took twenty minutes for a two-minute task." | Planning, review and polling multiplied the work without adding value. | Oversight cost |
| "The bill is many times what the task should have cost." | Every orchestration hop resent the whole working context. | Context resends |
| "It works, but slowly, and every fix uncovers another slowness." | Small failures layered on top of each other, each individually forgivable. | Cumulative failure |
| "It feels slow but the cost is small." (or the reverse) | Long tool calls, waits and cancellations make wall clock and token cost diverge. | Latency-cost divergence |
Each of these has a fix, but the fix is different per mechanism, which is why one-size-fits-all "optimise the prompt" advice rarely helps.
The biggest measured source of re-reading
In the four-layer stack I actually ran, the task passed through planning, execution, review, and polling or retry logic. Per-call traces showed that these layers existed and repeatedly received earlier context. A separate audit of five heavy sessions measured what made that repeated context so costly: machine output occupied 60.5 percent of the heaviest transcript.
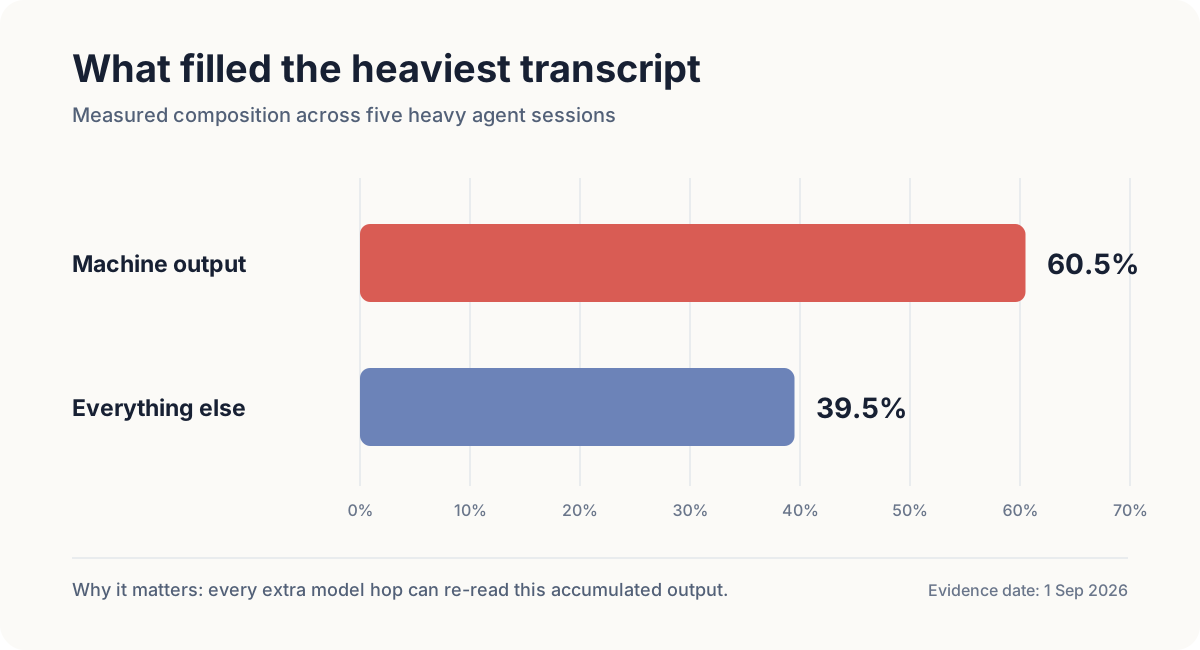
That is the defensible finding: additional orchestration creates additional model calls, and those calls often re-read material already paid for. The evidence does not support a universal 1×→4× multiplier, so this article no longer illustrates or claims one.
How the evidence was measured
The honest question is not "do agent systems get expensive" but "how would I know, in my own setup, before the bill arrives?" Here is what the evidence actually is.
The 551-session dataset. A few weeks of Codex work recorded every command, every file read and every plan change into about 3.3 GB of transcript. The counts are activity, not quality: 61,215 command executions, 2,537 screen views, 819 re-plans and 58 subagent handoffs. What mattered for this article is where the volume concentrated — the same instructions being carried and re-read hop after hop, and machine output bloating the material each turn carried.
Per-call traces on the one-agent-two-models comparison. Langfuse recorded every model call with tokens, latency and model. The four-layer stack could be compared against a direct path because both produced traces for the same task, so "oversight exceeded work" is a measurement, not a feeling.
The separate tool-time and token-time audits. A different audit of five heavy sessions showed about 60.5 percent of the heaviest transcript was machine output, and trimming it could have saved roughly 713,880 tokens of re-reading. That is an estimate from a different set of sessions, not a measured saving from the 551, and I label it as such rather than blending the two.
Known limits. These are one person's sessions on one rig, collected for activity not quality, so the patterns are hypotheses for your setup rather than universal laws. Token totals are workload evidence, not provider invoices. Where a claim is directional rather than measured, the text says so.
The attribution trap
Measurement fixes are not free, and two of the quiet ones nearly broke the dashboards before they fixed them.
Cumulative counters look like per-task totals until you subtract. Providers and local logs often expose lifetime session counters. A naive parser adds them up and double-counts every window where the counter carried forward. My own report tool had to sum per-window counts instead, and even then a compaction resets the counter mid-session, which is exactly the kind of trap a lifetime total hides.
Missing data renders as zero unless the pipeline marks it unknown. If a provider has no price for a model, the honest answer is "unknown spend", not "$0". My control-room dashboards now show $9.33 of known spend across the previous 24 hours with explicit unknown labels for the rest, because a confident zero is worse than a labelled gap.
Both were caught in my own pipeline. Both are the reason the dashboards deduplicate by provider and session and never render an unknown as zero. The telemetry stack article owns the full pipeline; this is the trap it exists to prevent.
What actually reduced the cost
The structural fixes are boring, and that is the point. Each one names the mechanism it targets.
Delete layers that do not repay their coordination cost. The one-agent-two-models comparison showed oversight across four orchestration layers exceeding the tokens spent doing the actual task. The fix was not tuning the layers; it was removing most of them and keeping one agent with a stated escalation rule. The architectural decision is owned by the multi-agent journey article.
Route by role, not by model loyalty. The routing rule is one sentence: cheap workhorse by default, frontier for genuinely hard work. The measured GLM routing benchmark, 63 percent faster long generations for about £2 more per busy day, shows what "genuinely hard" means in practice — a judgment call worth a stronger model, not a scary label that triggers escalation automatically.
Bound the tool output you would never read. The separate audit found about 60.5 percent machine output in the heaviest transcript, with a directional estimate of roughly 713,880 tokens of re-reading saved by trimming it. That is not a guarantee for every session; it is the shape of the waste.
Make stale workers replaceable instead of supervised. In the historical large session, one "recovery" child became a second orchestrator and recorded 44.1 million tokens while three bounded workers used 1.6 million. A stale-worker reaper plus owner-checked release is what makes a replacement cheap instead of a second bill.
Give empty polls zero-token exits. The cloud-agent work proved an empty-inbox check can run in normal code: the acceptance check completed in about 0.4 seconds with zero provider requests. The lesson generalises — routine absence of work should not be a reasoning problem.
Watch-outs. Removing layers is not automatically cheaper; the replacement must not become the new orchestrator, as the 44.1-million-token child proved. Boundless truncation loses context the task needed. And every one of these fixes changes a measurement, so re-check the dashboards after each change rather than assuming the fix worked.
Why this matters outside the terminal
"It took ages" and "it cost a lot" are different measurements, and the same trap exists in marketing data, where platform latency and platform spend get conflated. The habit of separating them transfers directly. If you take one sentence from this article: measure the mechanism, not the model.
Where to go next
- The agent telemetry stack — the pipeline that makes these mechanisms visible
- The multi-agent journey — the architectural decisions this evidence produced
- One agent, two models — the matched comparison behind the oversight finding
- I stopped my cloud agents burning tokens — the empty-poll fix in detail