The first analytics post on this site covered the whole stack: consent, dataLayer, web GTM, server-side GTM, BigQuery, Looker Studio, and the repo surfaces that made it durable.
Editor's note, 1 April 2026: the screenshots and transport details in this post reflect the March 2026 documentation pass. The GA4 property settings remain relevant, but the live site now uses client-side GTM and GA4 only rather than the former /metrics server-side transport.
This post is narrower and more operational. It zooms in on the GA4 property itself:
- what was configured in the property
- what was intentionally turned off
- what was promoted into reporting
- which live surfaces were checked
- which agent tools were used
- where the workflow got awkward and how those issues were handled
If you want the broader infrastructure story first, start with How We Built A Consented First-Party Analytics Stack On rajeevg.com. If you want the property-level implementation story, this is the one.
The planning lens
The guiding external reference for this pass was the full 77-page GA Reporting Playbook, October 2025.
What mattered most from that playbook was not a single magic setting. It was the framing:
- GA4 has multiple reporting surfaces, and they are not interchangeable
- Realtime, standard Reports, Explore, APIs, and BigQuery each answer different questions
- reporting quality depends on property configuration as much as on tags firing
- if custom parameters never become custom definitions, the reporting layer stays much weaker than the event stream underneath it
That sounds obvious, but it changes the workflow. It pushes the work away from "is GA installed?" and toward "is the property capable of answering the questions the site actually cares about?"
What “finished” meant here
For rajeevg.com, “finished” did not mean "every GA4 toggle in the UI was touched." It meant the property was coherent for a content-heavy portfolio and publishing system.
Property
498363924
Live GA4 property for the main site, with timezone corrected to London and reporting identity left on blended.
Web stream
G-675W3V0C78
Receives browser-side events for the main site. At the time of capture this flowed through /metrics; the live site now uses direct client-side collection.
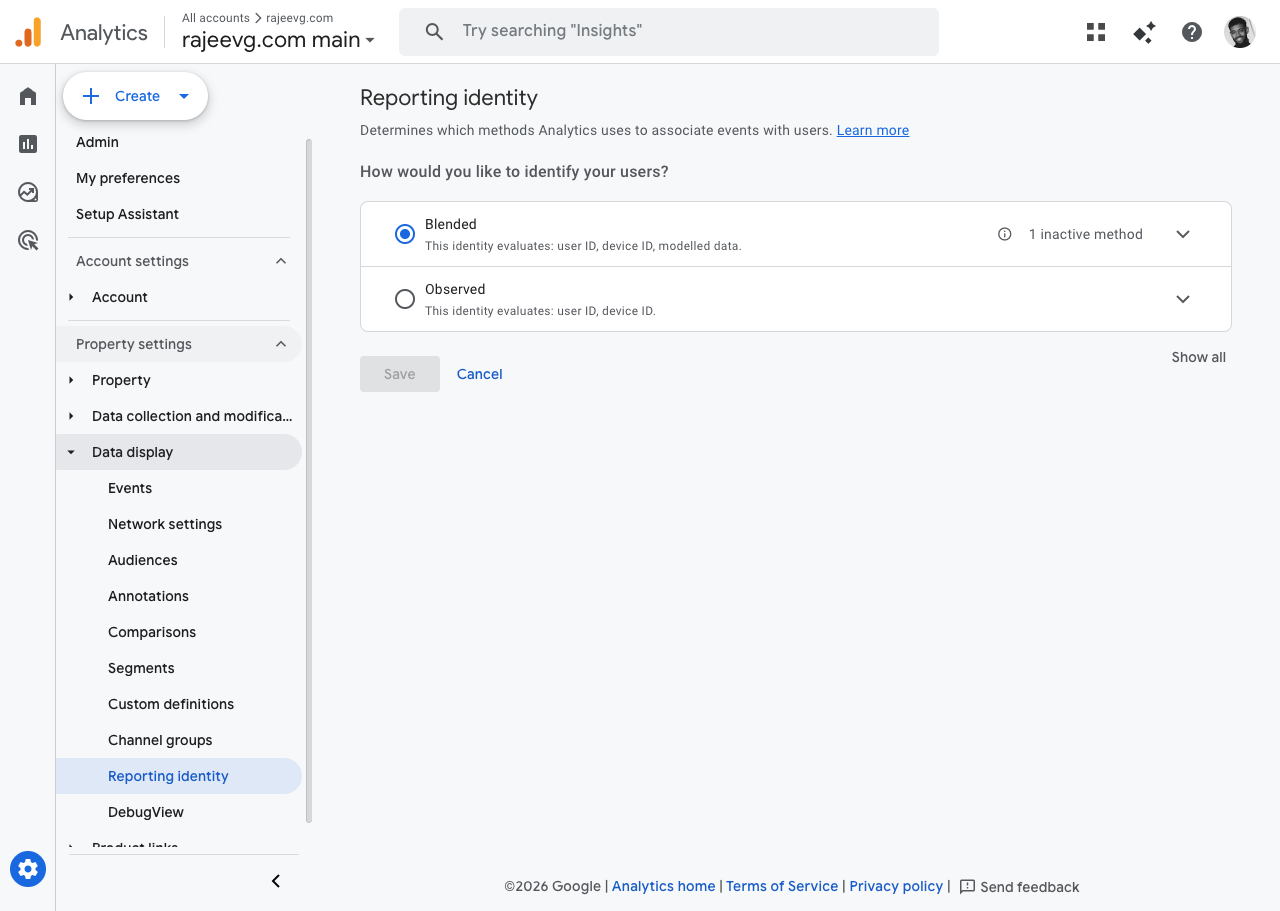
Reporting model
Blended
Chosen to preserve the GA4 reporting experience that best fits a consent-aware property with modeled behavior.
Live proof
Realtime + Admin
The final pass used the actual GA admin UI, the Analytics realtime API, and fresh production interactions on the site.
The finished property state I cared about looked like this:
| Layer | Live value |
|---|---|
| Site | https://rajeevg.com |
| Property ID | 498363924 |
| Display name | rajeevg.com main |
| Currency | GBP |
| Time zone | Europe/London |
| Service level | Google Analytics Standard |
| Measurement ID | G-675W3V0C78 |
| Reporting identity | Blended |
| Current transport mode | Client-side GTM + GA4 only |
| Web GTM container | GTM-K2VRQS47 |
| BigQuery dataset | personal-gws-1:analytics_498363924 |
The property screens that actually mattered
There are a lot of places to click in GA4 Admin. Only a handful mattered for this pass.
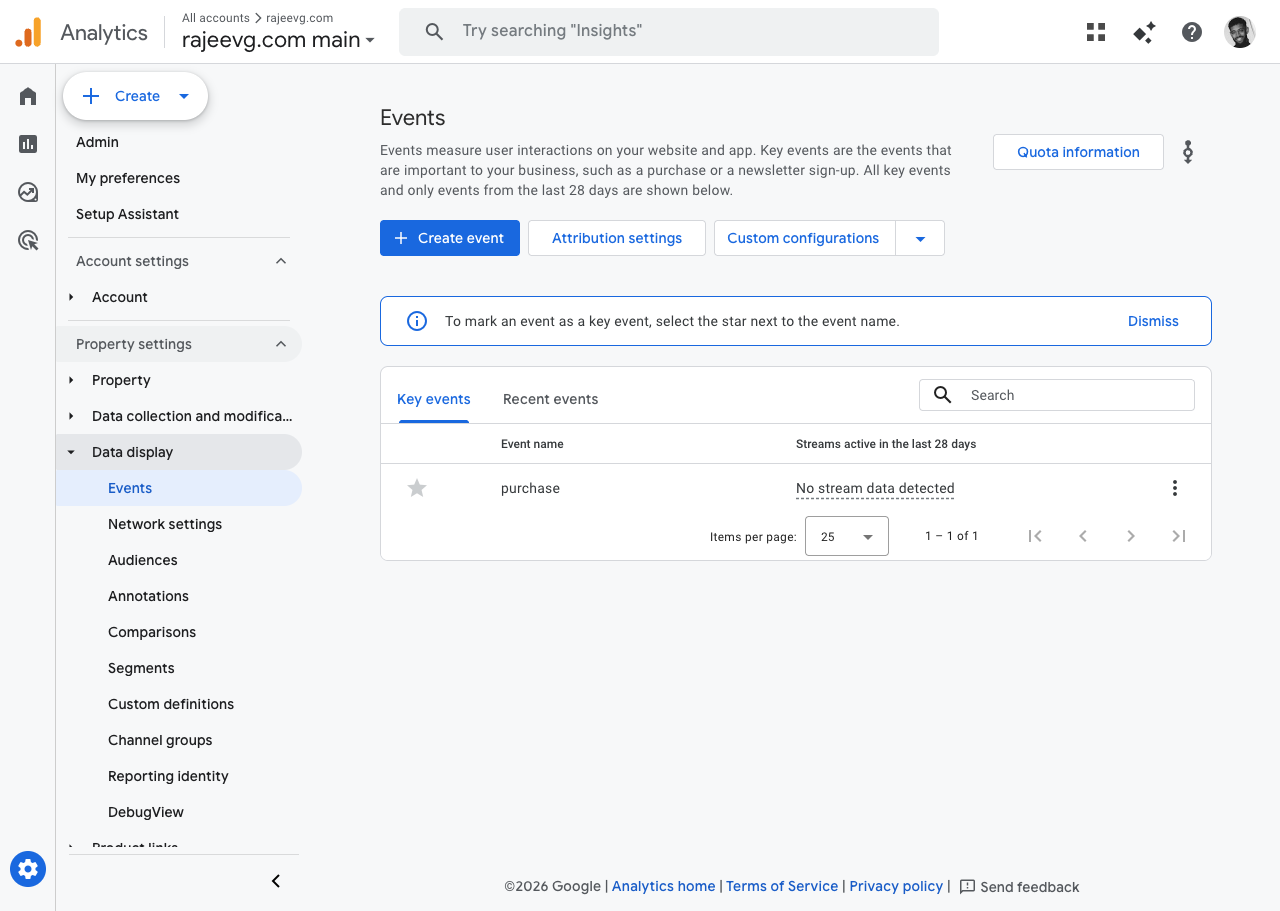
The first screen I cared about was the Events hub, because that is where the property’s key-event posture becomes visible.
GA4 Admin
Events hub in the live property
The second screen that mattered was Reporting identity.
GA4 Admin
Reporting identity left on blended
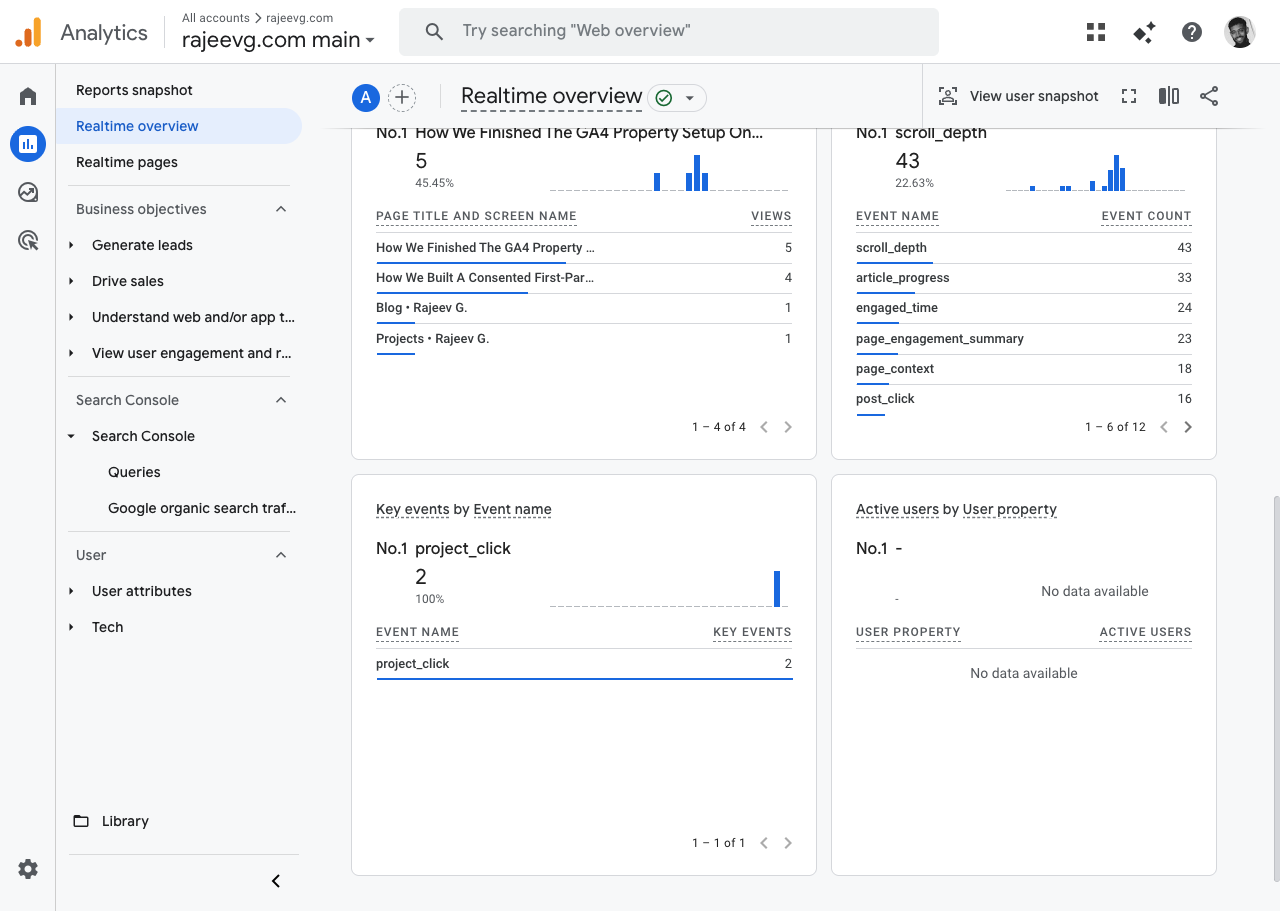
And the third screen was Realtime overview, because it is where the property proves it is not just theoretically configured.
GA4 Realtime
Fresh live activity after agent-triggered production interactions
I also checked DebugView because it is the obvious developer instinct, and the result was instructive:
DebugView
Useful, but empty until debug mode is actually enabled
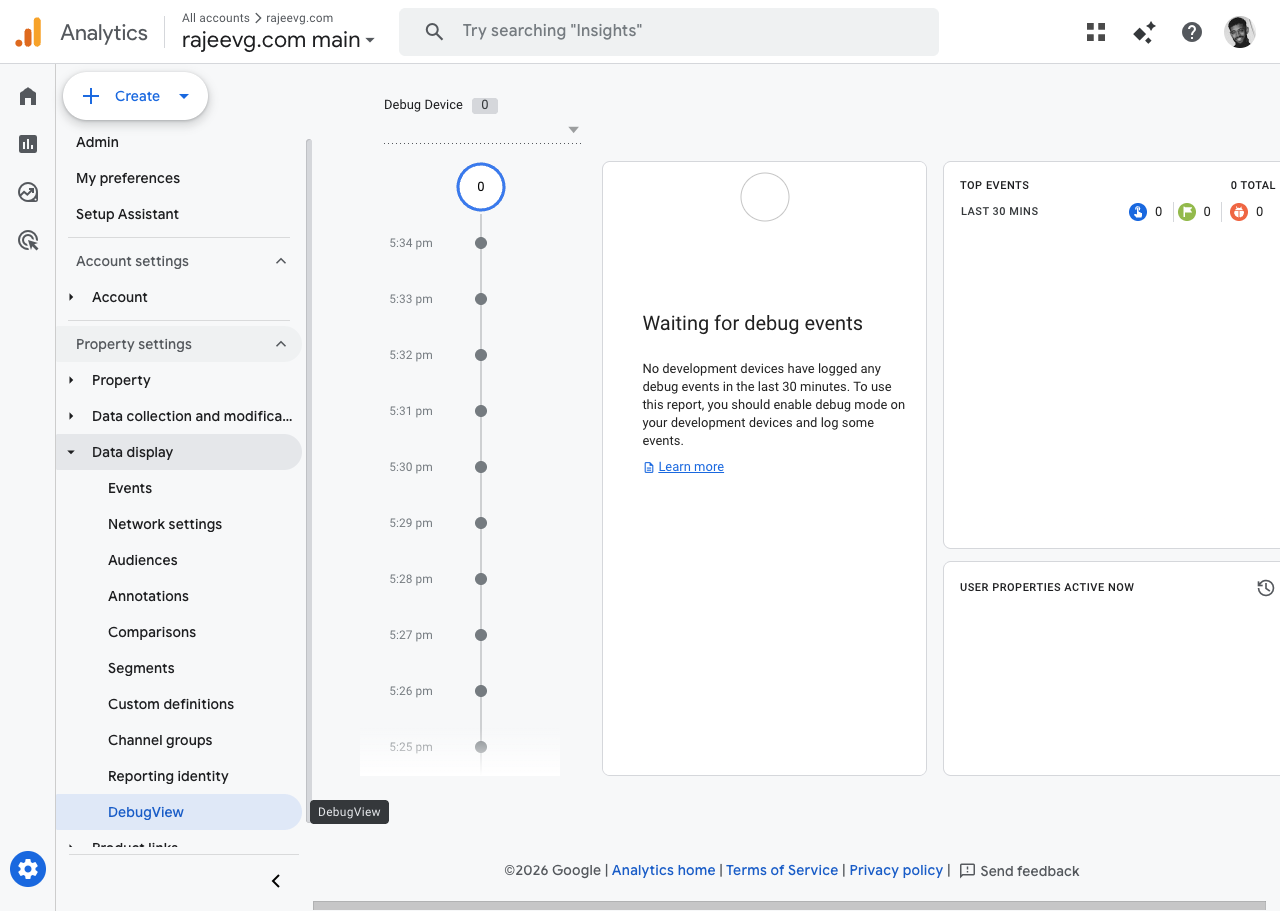
That empty DebugView is not a failure. It is a reminder that the right surface depends on the question:
- DebugView is great for debug-mode development devices
- Realtime is better for live-site proof when you want to verify traffic is reaching the property now
- standard reports are better once GA4 has had time to process and aggregate
The exact setup checklist
This is the part I wish more GA4 write-ups would spell out plainly.
1. Property metadata had to stop being generic
The property itself was checked and corrected first:
- timezone was updated to
Europe/London - currency was confirmed as
GBP - reporting identity was left on
Blended - Google Signals stayed enabled
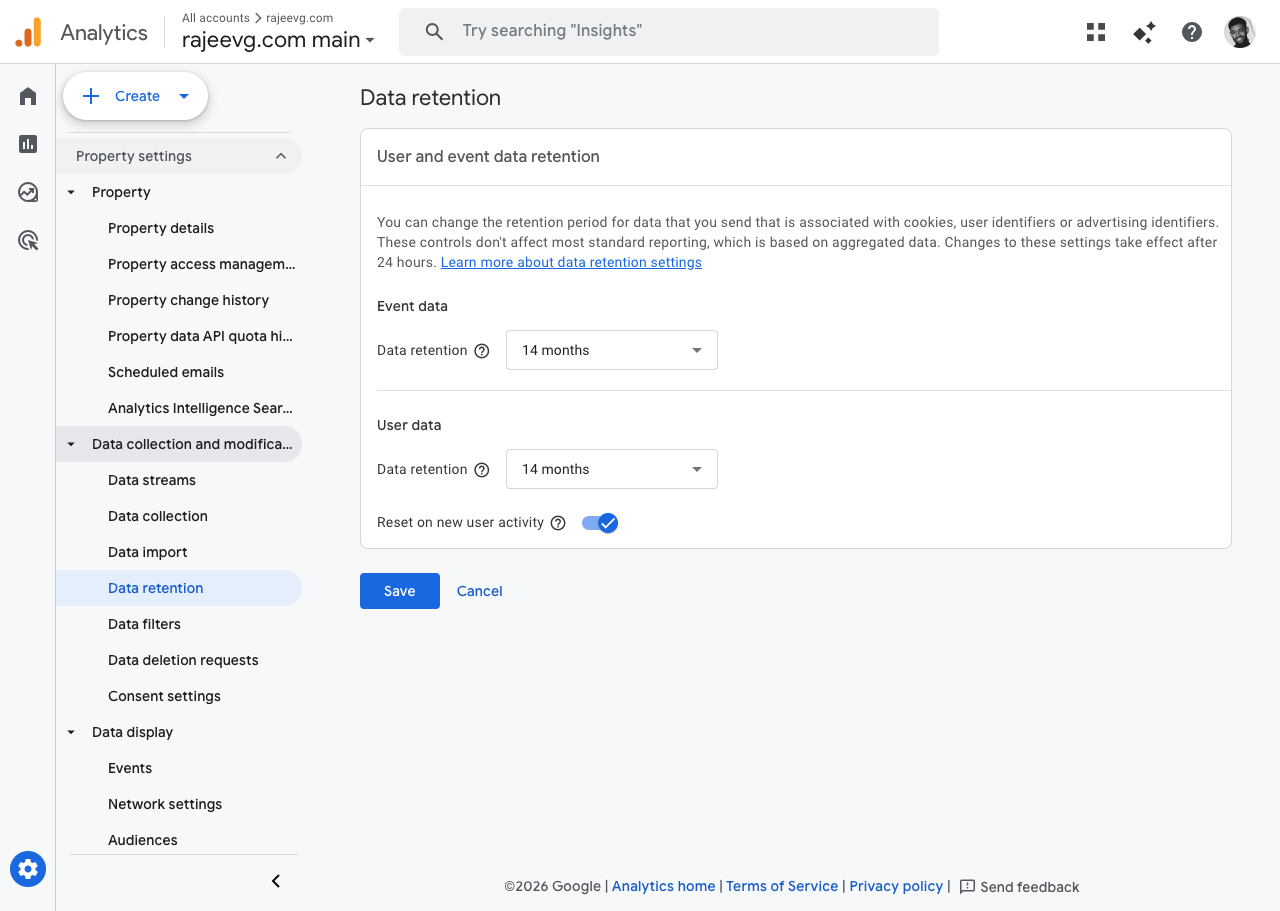
- event and user data retention were both set to
14 months Reset on new user activitystayed enabled
This sounds small, but it has real downstream effects. A wrong timezone quietly distorts daily reporting, dashboards, and stakeholder conversations. Fixing the timezone was one of the highest-signal property cleanups in the whole pass.
GA4 Admin
Data retention explicitly set to the 14-month window
2. Auto-collected noise needed to be trimmed
One of the easiest ways to make a GA4 property feel "kind of messy" is to let enhanced measurement and custom event modeling overlap.
That is exactly what needed cleanup here.
The site already had a richer application-owned event model for:
project_clickpost_clicknavigation_clickscroll_depthpage_contextpage_engagement_summaryblog_searchcopy_code
So the property setup intentionally disabled some enhanced-measurement defaults that would muddy that vocabulary:
- outbound-click auto collection was turned off
- scroll auto collection was turned off
This left the site’s own custom vocabulary in charge instead of asking GA4 to emit a parallel, lower-context version of the same behavior.
3. The right key events had to be promoted
For this site, the important outcomes are not ecommerce purchases. They are:
contact_clickproject_clickprofile_click
Those are the interactions I actually want surfaced, trended, and visible in reporting.
The awkward footnote is that the property also had a legacy purchase key event hanging around. That could not be cleanly removed through the Admin API during this pass, so it was documented instead of silently ignored. That is the kind of detail worth saying out loud in an implementation record.
4. The custom parameters had to become first-class reporting fields
The site’s event stream was already richer than vanilla GA4. The problem was that an unpromoted parameter is still second-class inside reporting.
The property pass therefore promoted the important event parameters into GA4 custom definitions.
Some of the dimensions that matter most on this site are:
analytics_consent_stateanalytics_sectioncontent_slugcontent_idcontent_tagspage_typesite_sectionviewport_categoryscreen_orientationcolor_schemethemefilter_stateselected_tagssearch_termreferrer_type
And some of the metrics that matter most are:
result_countscroll_depth_percentarticle_progress_percentpage_view_sequenceengaged_seconds_totalinteraction_sequenceinteraction_countroute_depth
This is the move that turns a nice dataLayer into a property that can actually answer content and portfolio questions later.
The live user journey that produced the proof
I did not want this write-up to rely on "trust me, the agent saw it."
So I triggered a fresh proof trail directly on the production site and then checked the live property.
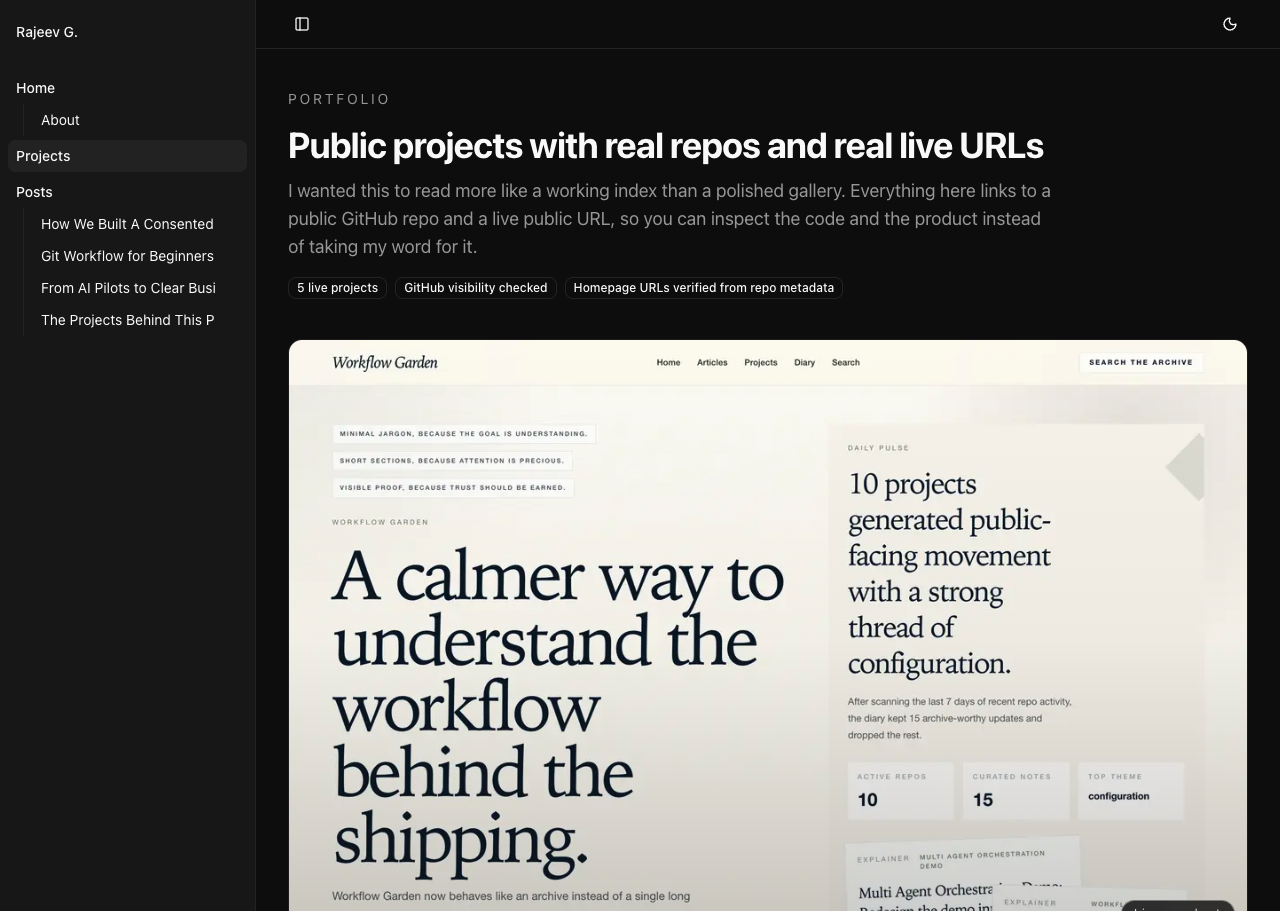
The project interaction started on the public projects page:
Production Site
The public projects page used for the proof run
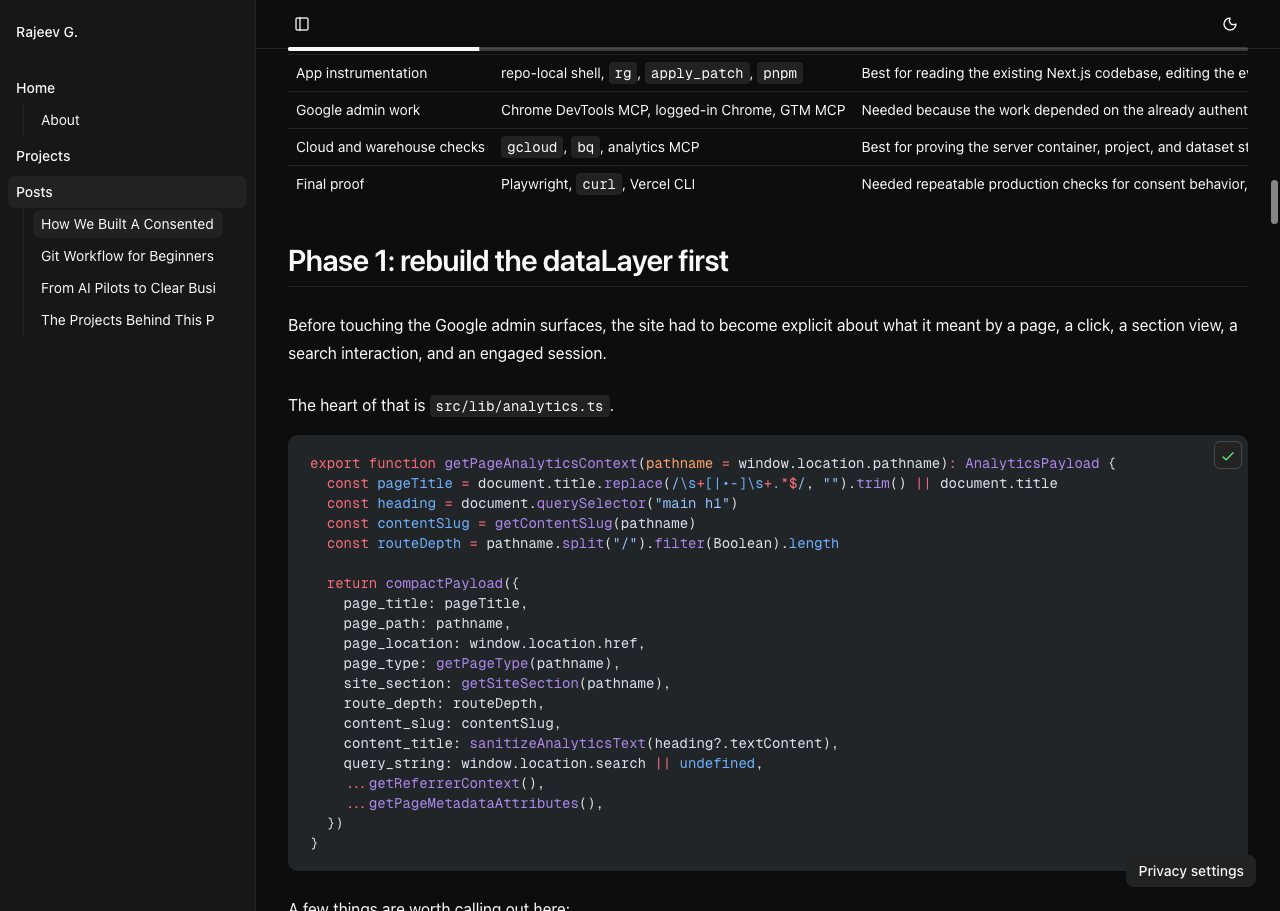
Then I used the production analytics article itself as a second interaction surface:
Production Site
The live article used to trigger richer content events
Those two live-site actions were enough to verify that the property was receiving more than passive page views.
The resulting pattern in GA4 matched the intended model:
- content reading created
page_context,section_view,scroll_depth, andpage_engagement_summary - project interaction created
project_click - code block interaction created
copy_code - realtime reporting reflected the live property state within the same pass
The agent toolchain, in plain English
This was not "one AI tool did everything." It was a toolchain, and different parts mattered for different reasons.
| Tool | What it was used for | Why it was the right tool |
|---|---|---|
web | Opening the 77-page GA Reporting Playbook PDF | Best way to confirm that the exact reference document existed and was really the full 77-page version |
repo shell + rg + apply_patch | Editing the site, writing this post, and reading the existing analytics implementation | Best for repo-local work and content changes |
analytics_mcp | Reading property details, custom definitions, and realtime API data | Best system-of-record tool for GA data without relying on the UI alone |
gtm_mcp | Publishing GTM-side changes in the earlier analytics pass | Best for making live tagging changes without fragile manual clicking |
chrome_devtools | Capturing authenticated GA admin and realtime screenshots | Best once a real signed-in Chrome session was available |
playwright | Testing whether an isolated browser context could reach the GA admin surfaces | Useful as a first attempt, but it hit the Google sign-in wall |
vercel CLI | Shipping the new article to production | Best direct route for a deliberate prod publish |
The more interesting story is not just the list of tools. It is how the tool selection changed when reality got in the way.
What went wrong, and how that got handled
1. The first browser path hit Google sign-in
The first attempt to open Google Analytics used the Playwright browser tool. That landed on the standard Google sign-in flow instead of the already-authenticated property.
That was not a dead end, but it meant Playwright was the wrong browser for this part of the job.
The fix was to switch to the Chrome DevTools MCP, which had access to a live signed-in Chrome session and existing GA tabs. That immediately unlocked:
- the property admin screens
- the realtime overview
- the reporting identity screen
- a truthful screenshot trail from the real property
This is a small example of a larger lesson: when the job depends on live authenticated state, the right browser matters as much as the right script.
2. DebugView was not the best proof surface
I checked DebugView because it was the natural "developer verification" instinct.
It was empty.
That happened for a simple reason: the site sessions used for the proof run were not explicitly marked as GA debug devices. DebugView therefore had nothing to show, even though the property itself was receiving events perfectly well.
The fix was not to force the wrong tool harder. The fix was to switch proof surfaces:
- use Realtime overview for live production validation
- use the Analytics realtime API to confirm event names and counts
- use DebugView only when debug-mode traffic is actually part of the flow
3. One admin screen briefly lagged behind the underlying property state
During the first capture pass, the Custom definitions admin page briefly rendered like an empty table even though the property definitely had promoted definitions.
That is the kind of moment where it is tempting to keep reloading the same screen and lose time.
Instead, I cross-checked with the Admin/Data API and treated that as the authority first. Once the property state was confirmed there, I came back and recaptured the UI only after the definitions table had fully populated. That made the API the source of truth and the UI screenshot a verified illustration instead of a guess.
4. Legacy configuration still leaks into “clean” setups
The property had a legacy purchase key event that did not fit the site and could not be cleanly removed through the Admin API in the same way the newer events were managed.
The right response was not to pretend it did not exist.
The right response was:
- document it
- avoid building new reporting logic around it
- make sure the genuinely relevant key events were configured correctly
5. Realtime is fast, standard reports are not
Another small but important difficulty is expectations management.
The property can be correctly configured, and the live event flow can be correct, and yet the standard reporting surfaces still lag behind Realtime.
That is normal GA4 behavior.
So the proof order that worked best here was:
- trigger live production interactions
- confirm them in realtime
- confirm property settings in admin
- let the standard reports and warehouse layers catch up on their normal timelines
The realtime proof, beyond the screenshot
The GA4 screenshot is the human-readable proof. The realtime API gave the tighter machine-readable cross-check.
After the production interactions in this pass, the property’s realtime event mix included:
project_clickcopy_codepage_contextsection_viewscroll_depthpage_engagement_summaryengaged_time
That matters because it proves the setup is not just receiving default GA4 events like page_view and user_engagement.
It is receiving the site-owned vocabulary the whole system was designed around.
Why the property setup and the stack post belong together
The first analytics post on this site is still the broader system-of-record story. This new one exists because the property layer deserves its own explanation.
The stack post answers:
- how collection gets to GA4
- how consent works
- how GTM and server-side GTM are wired
- how BigQuery and Looker fit in
This property-focused post answers:
- which GA4 screens mattered
- what the live property is actually set to
- how the reporting choices were made
- how the browser and API proof were gathered
- where the agent workflow had to adapt
That division feels healthier to me than cramming everything into one giant article.
If I had to do the property pass from zero again
I would do it in this order:
- fix property metadata first: timezone, currency, identity
- clean up enhanced measurement so custom events stay authoritative
- promote the real key events
- promote the reporting parameters into custom definitions
- verify live traffic in Realtime before chasing standard reports
- only use DebugView when a debug-mode session is intentionally part of the workflow
- document the awkward leftovers, instead of pretending every legacy artifact disappeared
That order sounds boring. It is also the order that prevents a lot of bad analytics implementations from becoming quietly confusing.
The files and proof surfaces I would open first next time
If future me had to re-enter this setup quickly, these are the first places I would check:
- The broader analytics stack post
- Analytics contract on GitHub
- Google tagging stack audit on GitHub
https://analytics.google.com/analytics/web/#/a362795631p498363924/realtime/overviewhttps://analytics.google.com/analytics/web/#/a362795631p498363924/admin/events/hubhttps://analytics.google.com/analytics/web/#/a362795631p498363924/admin/identityspace
And if the question was "is the property actually receiving the right traffic right now?", I would trust this order:
- site interaction in production
- Realtime overview
- Analytics realtime API
- standard reports later
Why this pass was worth documenting separately
A good analytics setup is easy to flatten into a vague sentence like "GA4 is configured."
That sentence hides almost everything that matters:
- which reporting assumptions were chosen
- which auto-collected events were deliberately disabled
- which business events were promoted
- which property screens were actually checked
- how live proof was gathered
- how authenticated browser issues were handled
This pass was worth documenting because the property is no longer just "present." It is shaped around the site’s real reporting questions, and it has a proof trail that shows how the setup was verified instead of merely declared.