AI & Agent Systems
LLM Pareto Frontier
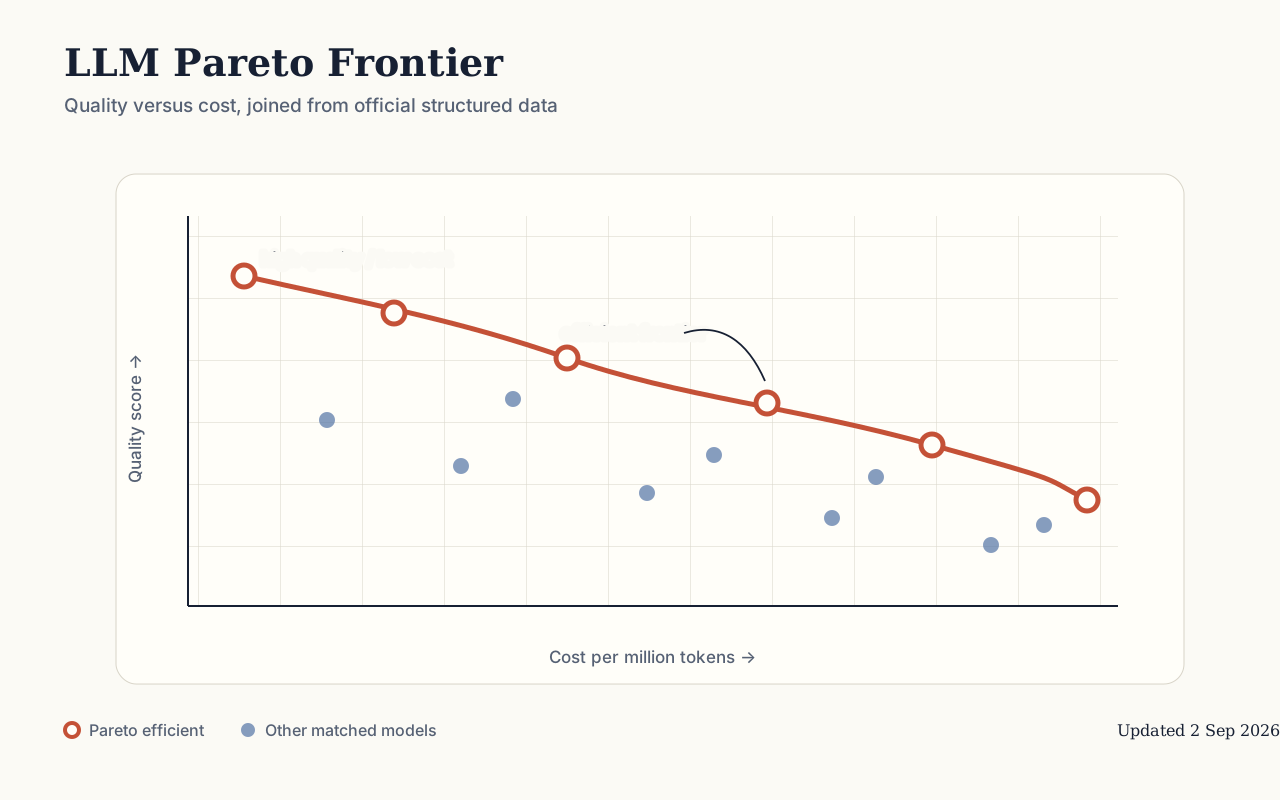
A live quality-versus-cost map of major language models, with the efficient frontier calculated in the browser.
What it is
The dashboard joins current benchmark, price and community-preference data so model choices can be inspected as a trade-off rather than reduced to a single leaderboard. Filters expose the frontier for different model cohorts, while unmatched records remain visible instead of being silently dropped.
A typed Next.js data pipeline normalises official structured feeds from Artificial Analysis, OpenRouter and LM Arena, resolves conservative model aliases, and computes the non-dominated quality-and-cost frontier. Four chart implementations make rendering weight and interaction trade-offs directly comparable.